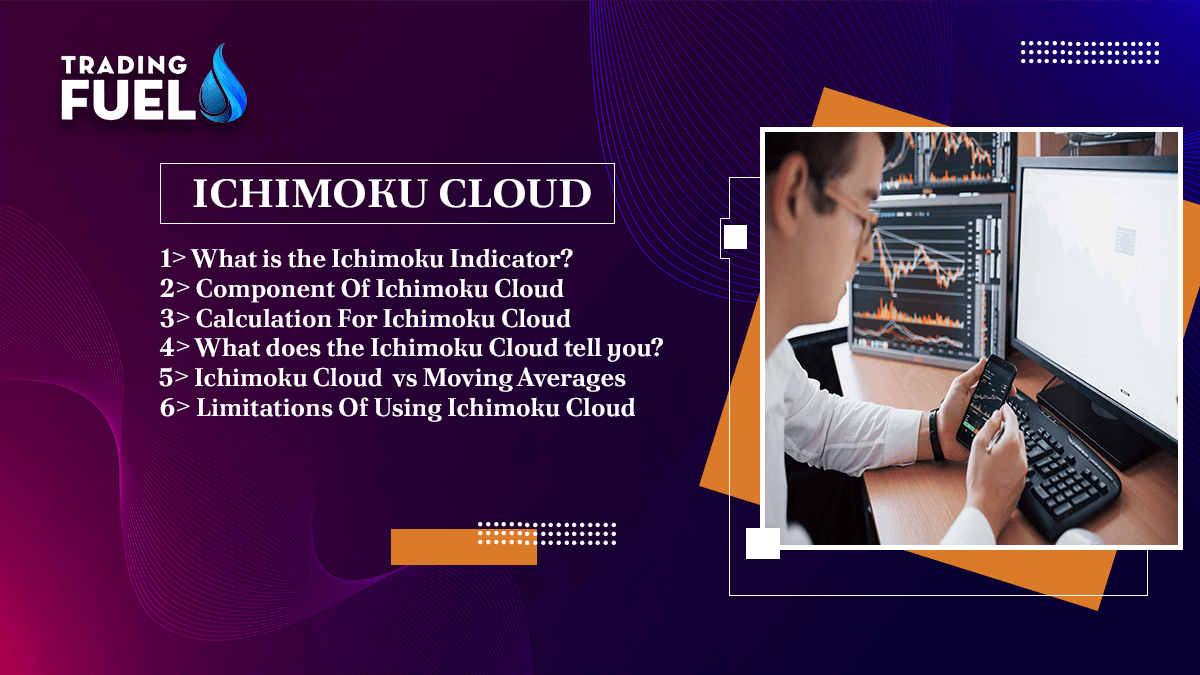
Ichimoku Cloud Indicator
What Is the Ichimoku Indicator? In Japanese the meaning of Ichimoku kinko hyo is “one glance equilibrium chart”, it was […]
Read More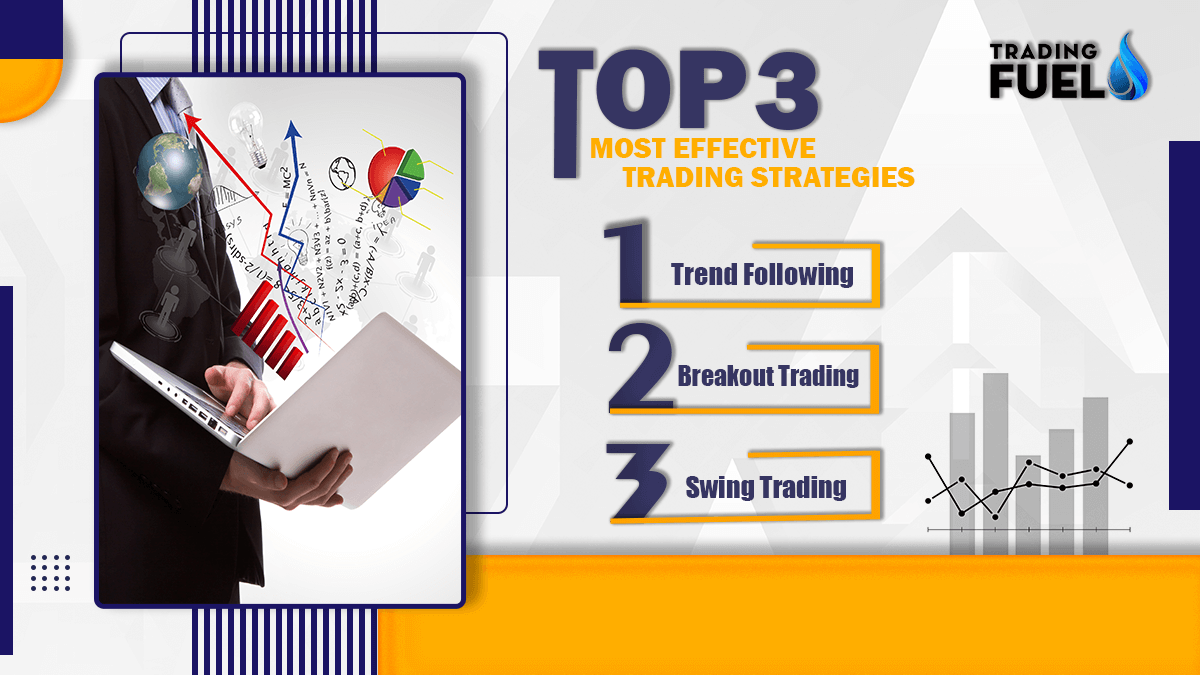
Top 3 Most Effective Trading Strategies
Learn how to make money trading stocks by following these proven Top 3 Most Effective Trading Strategies! Must Know!
Read More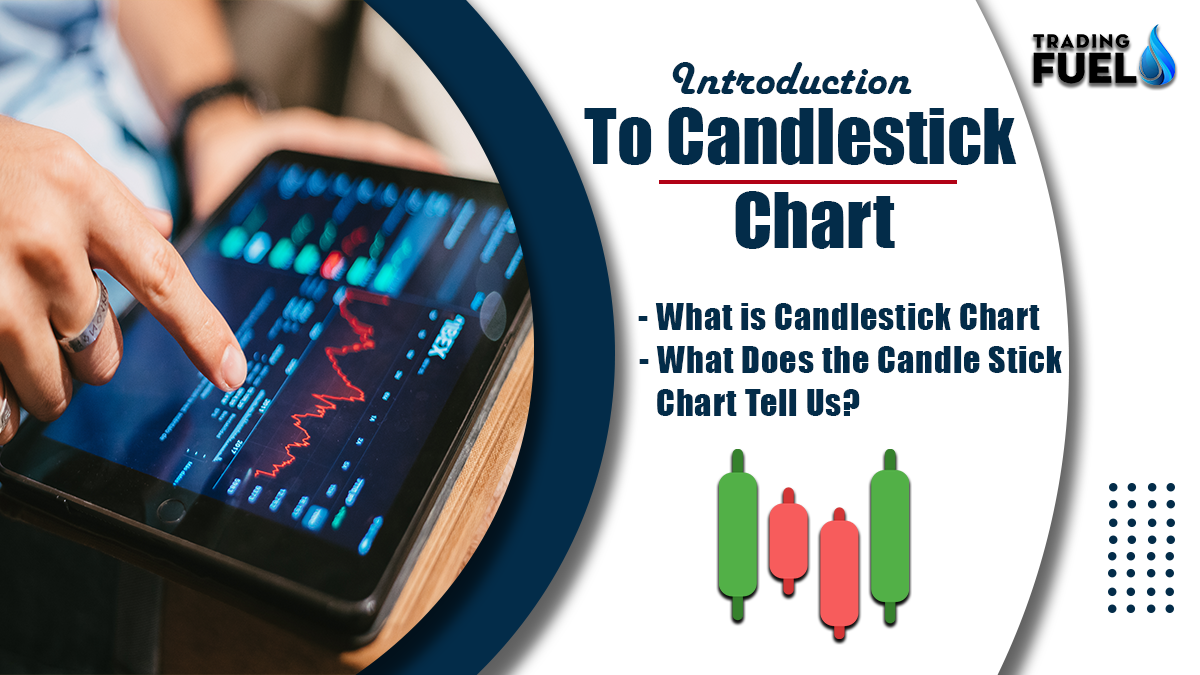
Introduction to Candlestick Charts
Get to grips with candlestick charts and see how they can help you understand the market better.
Read More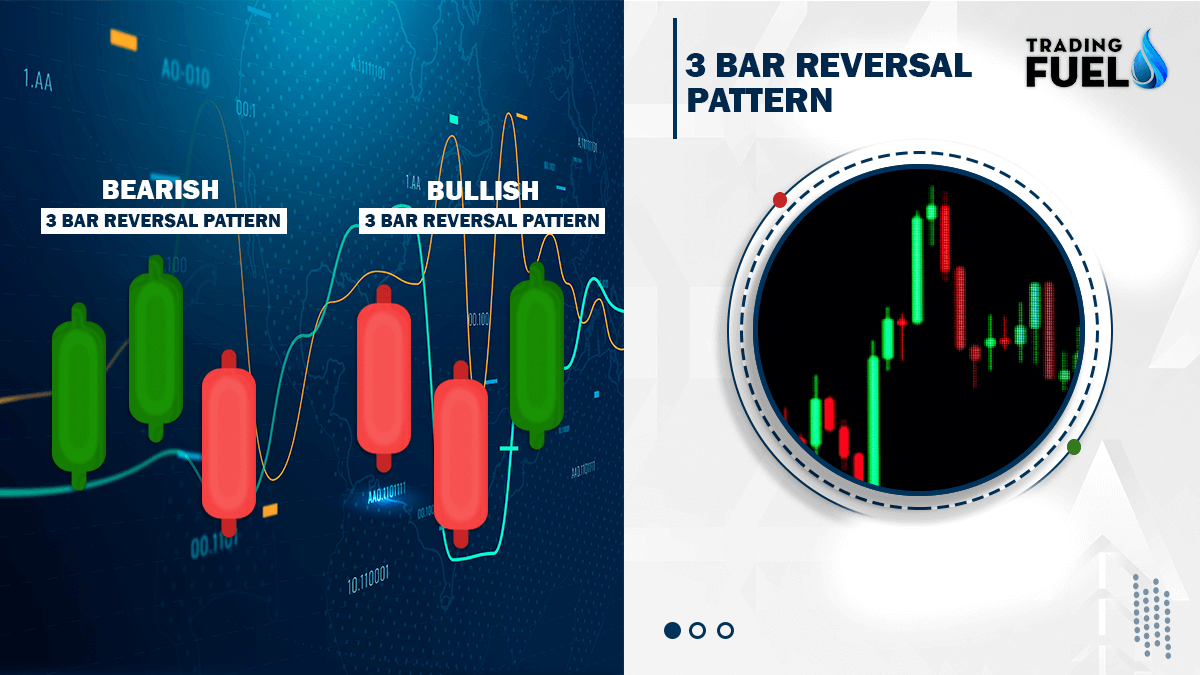
3 Bar Reversal Pattern
The Three-Bar Reversal Pattern can be adapted easily for day trading. When combined with other analysis, it gives an excellent entry point for day traders.
Read More
What is RSI in Stock Market?
What is RSI in Stock Market?: Relative Strength Index (RSI) is a momentum oscillator used in the analysis of financial […]
Read More
NR7 Bar Scanner and Strategy
NR7 Bar Scanner and Strategy: The Narrow Range 7 bar (NR7) is a technical analysis pattern that traders use to […]
Read More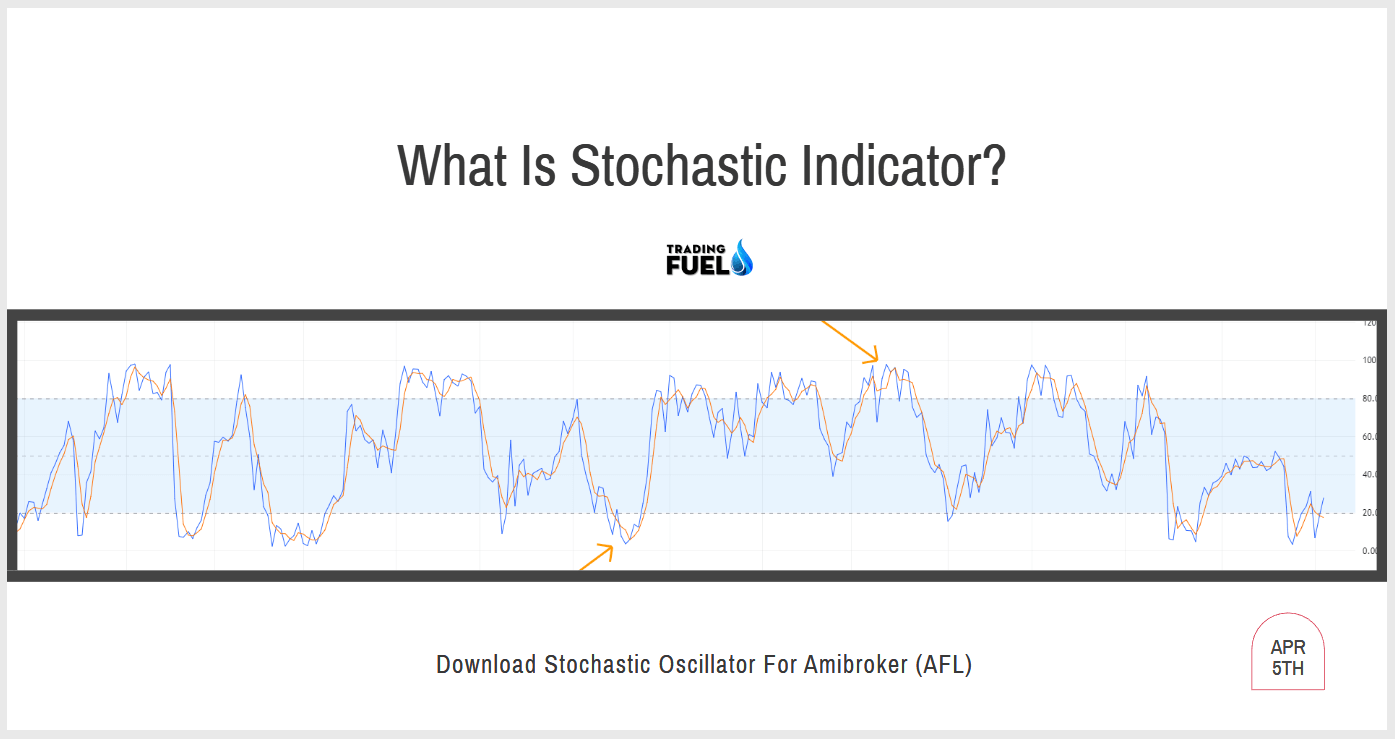
What Is a Stochastic Indicator?
The Stochastic Oscillator is a momentum indicator that measures the relationship between the closing price and the range of an […]
Read More