
Reversal Chart Patterns: Part-3 || (Trading Fuel | Research Team):
1. Falling Wedge Chart Patterns:

i. What does a falling wedge look like?
Falling wedge is a bullish pattern that starts wide at the top and contract as price moves lower.
Falling wedge patterns have lower highs & lower lows and its price action is enclosed within two lines inclined at an angle.
These trend lines converge at the bottom.
New trend direction on the breakout from the falling wedge pattern will be an up move.
Falling wedge patterns have a high failure rate.
Irrespective of the type (reversal or continuation) falling wedge is regarded as bullish patterns.
They are relatively easy to spot and tend to work well in the bearish market.
ii. How to trade falling wedge?
Trade:
The wedge patterns are defined by the trend lines connecting the lower high and lower lows. A trend line breakout suggests a long entry. We enter a trade after a clear breakout from the trend line occurs. One can enter after a candle close above the high of the breakout candle.
Target:
Place a target at the swing high level of the wedge patterns.
A second target is set at the depth of the wedge pattern form the breakout level.
Stop:
Stop order is placed below the lowest level of the wedge pattern.
iii. Component of the falling wedge:
Prior trend:
To qualify as a reversal patterns there must be a prior trend to reverse. The falling wedge will form after a strong downtrend.
Upper resistance line:
It takes at least two swing highs to form the upper resistance line, ideally three. Each swing high should be lower than previous highs.
Lower support line:
It takes at least two swing lows to form the lower support line, ideally three. Each reaction swing low should be lower than the previous low.
Contraction:
The upper resistance line and lower support line converge at an apex point. The swing low still penetrates the previous low, but this penetration becomes shallower. As the difference between the lows decrease it indicate decrease in the selling pressure.
Resistance break:
Bullish confirmation of the pattern does not come until the resistance line is broken with heavy volume. Once resistance is broken there can be a retest of the resistance line which provides us, good trading opportunist.
Volume:
Volume is not important on a rising wedge, it is essential to confirm a falling wedge breakout. Along with breakout of price there must be a supporting volume (surge in volume) which confirms the trend.
iv. Example for falling wedge:
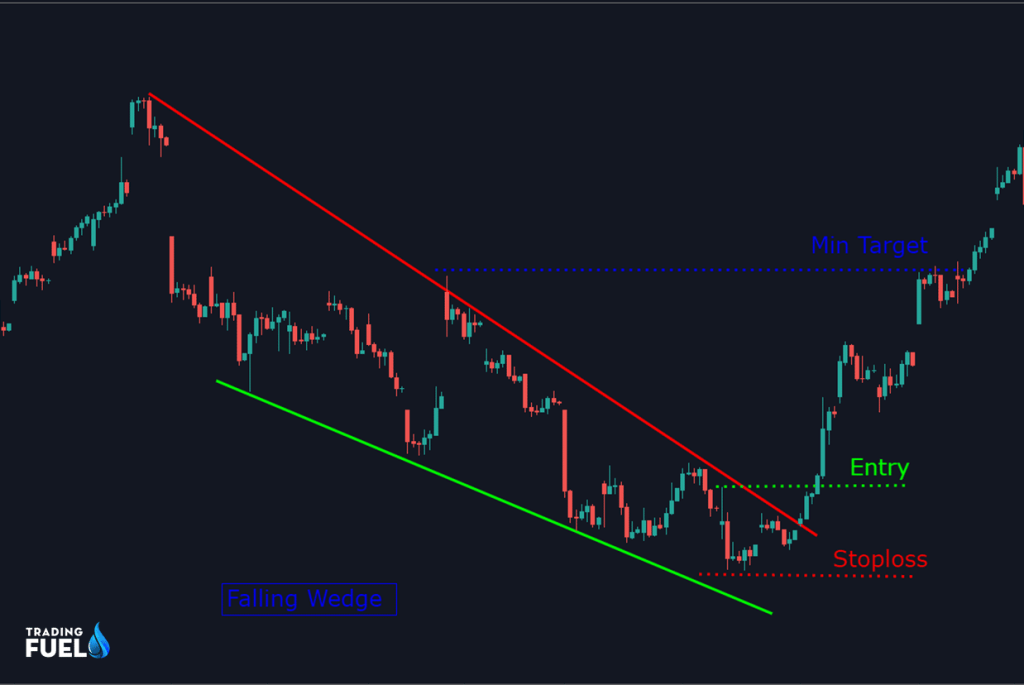
Entry:
We entered a long trade after a bullish candle breaks the high of the break out the candle. Breakout candle breaks and closes above the resistance level (red line).
Exit:
Exit can be done near previous resistance area or based on risk to reward ratio, here we are getting risk to reward ratio 1:3 near previous swing high.
Stop loss:
For a valid pattern failure price must close below the previous swing low, so for safety we are placing a stop order below the previous swing low.
2. Rising Wedge Chart Patterns:
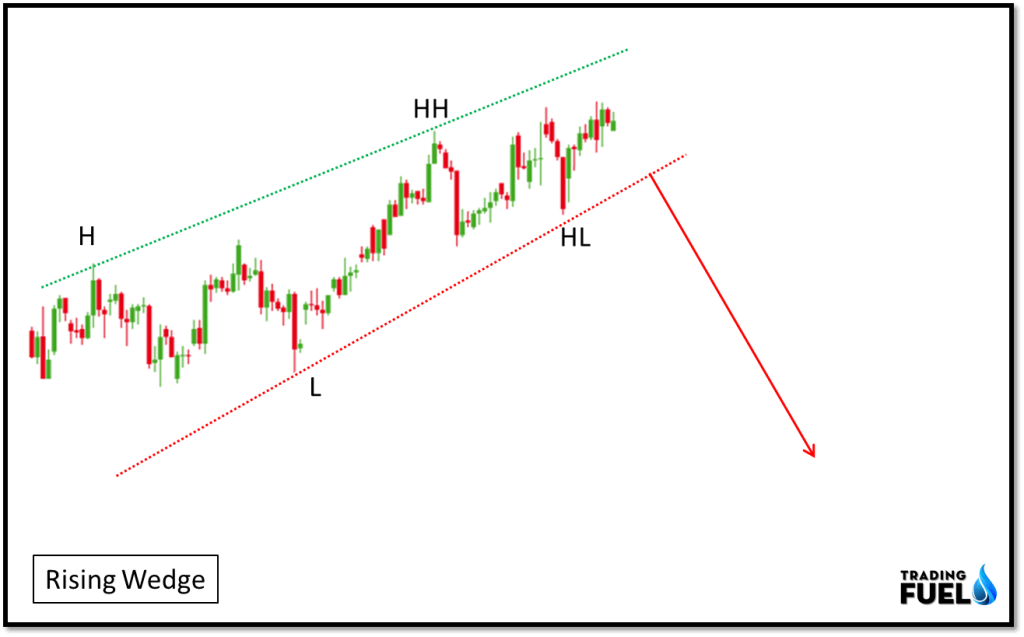
Rising wedge patterns are similar to the triangle as they form at an angle.
Rising wedge patterns have higher highs and higher lows and its price action is enclosed within two lines inclined at an angle.
These trend lines converge at the top.
New trend direction on the breakout from the rising wedge pattern will be a downside move.
Falling wedge patterns have a high failure rate.
They are relatively easy to spot and tend to work well in a bullish market.
3. Rounding Bottom Chart Patterns:

i. What does a rounding bottom look like?
Rounding bottom pattern form after a strong downtrend.
Rounding bottom is a relatively reliable pattern and easy to spot at the bottom of the downtrend.
Rounding bottom is similar to a rectangle pattern and they may be better visible in the higher timeframe.
A trend line (red) is drawn connecting the swing high of the round bottom pattern.
The round bottom pattern has a long base and provides more profitable trades.
ii. How to rounding the bottom?
Trade:
A trend line is drawn by connecting previous swing high of the round bottom. If the price breaks this trend line with heavy volume it signals a breakout and a long trade. Enter a long trade above the high of the breakout candle.
Target:
There are two potential trade targets possible in round bottom pattern.
The first target is the depth of the round bottom form the breakout.
The second target will be the previous swing high.
Stop:
The rounding bottom pattern is traded on the based on the trend line breakout. Pattern failure can occur if the market began downtrend after it closed above the trend line.
iii. Component of rounding bottom:
Prior trend:
Rounding bottom is a reversal pattern, it is better if the earlier trend is up otherwise there is a high probability of pattern failure.
Ideally, the low of the rounding bottom will be the swing low of a downtrend. But practically the swing low of the downtrend may differ from the low of rounding bottom.
Decline:
The prior trend of the rounding bottom is the decline that leads to the formation of swing low. This decline can take on different forms some are quite narrow with several swings high and lows, while other trade lower in more liner form.
Low:
The low of the rounding bottom can be in the shape of “v” bottom. But should not be too sharp and must take some time to form, because such a sharp decline and rise in price is not a confirmation of trend reversal. As in v shape bottom, the possibility of selling climax exists.
Advance:
The advance from the low of the pattern must be symmetric to the right half of the pattern and should take about the same time as the prior decline. If the advance is too sharp then the validity of the rounding bottom may be in question.
Breakout:
A bullish signal comes when the price breaks the high form by the pattern during decline with heavy volume. After the breakout, this resistance level will turn to support and it is likely to be tested again before up move start.
Volume:
Ideally, the volume should be high during a decline and during the formation of the swing low, the volume is likely to decrease and increase during an advance. Volume level is not too important in decline but there must be a supporting volume during a price advance.
4. Rounding Top Chart Patterns:

Rounding top pattern form after an uptrend.
Rounding top is a relatively reliable pattern and easy to spot at the top of the uptrend market.
Rounding top is similar to a rectangle pattern and they may be better visible in the higher timeframe.
A trend line is drawn connecting the swing low of the round top pattern.
i. Example for rounding top:

Entry:
After the price is forming a rounding top kind formation we marked the swing low and form a trend line, we can enter a short trade after this trend line is a broken (shown by the red line).
Exit:
Exit can be done near the previous support area or based on risk to reward ratio, here we are getting risk to reward ratio 1:2.
Stop loss:
Stop-loss can be placed above the previous swing high (above the neckline), if swing high is broken, it will be an indication of bull in the market and failure of our pattern.
Conclusion:
In the earlier two blogs, we have discussed the reversal patters this is the last blog of a reversal Chart Patterns series. Reversal setups are easy to identify because of their structure as they take longer time information than another setup. Reversal setup has a higher probability of success. One can easily learn and earn form patterns if the basis of the price action is clear to them theory like Dow Theory, price and volume analysis, candlestick pattern, resistance, and support. It is must that each trader follows proper risk management and trade only higher risk to reward setup.
Contain & Image ©️ Copyright By, Trading Fuel Research Lab