
ADX indicator is one of the most popular technical analysis indicators. ADX indicator is effective in use for tracking the trend. ADX stands for Average Directional Index. It is a strong indicator as it shows how strong a trend is developing. It does not directly give buy or sell signals but it represents the strength of a movement, but not the direction. Traders can get the idea about the strength of the trend by using ADX.
The higher value of the ADX indicator indicates the strong trend and lower value indicates the weak trend.
ADX Indicator Formula
ADX Indicator value is determined by the below equation:
Determine the True Range (TR) + Directional Movement (+DM) and – Directional Movement (-DM).
This will help to compute the + DI and -DI Lines.
True range is the largest of these values:
Current High – Current Low
Current High – Previous Close (Absolute Value)
ADX Indicator Calculation

How to Use the ADX Indicator?
As we discussed earlier, that the ADX is trend strength indicator, so you can use the information for conformation of trend. When the ADX line is above the 20 level, then it means that there is strong trend movement (uptrend or down trend). The ADX line is plotted on a continuous graph of 0 to 100. The different value of ADX shows the different market trend.
- 0-20 – lack of trading market
- 25-50 – Indicates strong market trend
- 50- 75 – indicates a robust trend
- 75-100 – indicates extremely strong trend
From the below image you can see that the stock price is trading in a range (Sideways) as the ADX is below 20. The green line id +DI line and the red line is –DI line and the blue line is ADX Line.

Buy and Sell signals
When the ADX line cross the 20 level and goes up, the signal given by ADX is valid. When the ADX is below 20, signals generated by it will be false.
When the +DI line cross the –DI line, you can go for buy and –DI cross the +DI, then you can go for sell. Make sure that during the crossover of +DI line, the ADX value is greater than 20.
This is the basic fundamentals of the ADX. Now let’s see trading strategy with ADX.
Average Directional Index Strategy
Here, from the below section we will see some trading strategy based on ADX Indicator, which you can use in your trading.
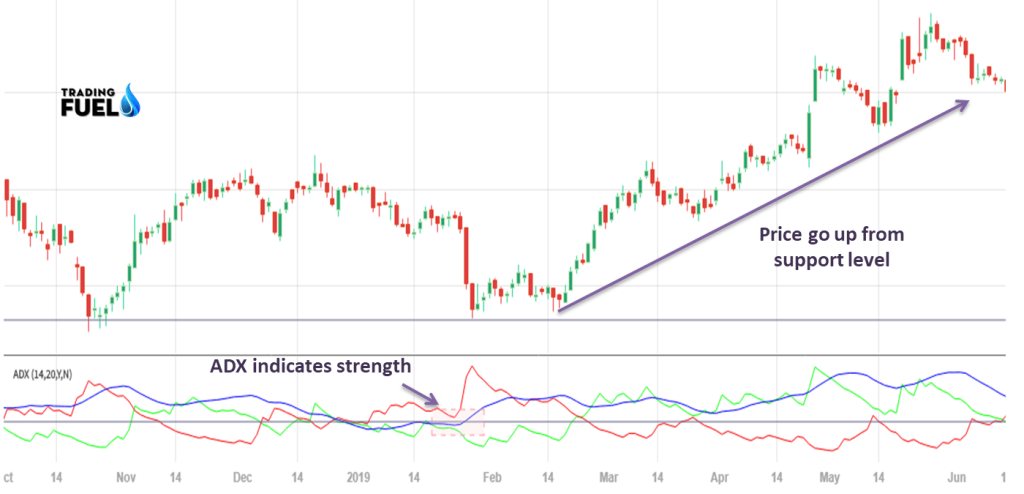
ADX Breakout Strategy
For this strategy, draw the support and resistance level or trend line on the chart. When the price gives buy or sell breakout and during the breakout ADX crosses the 20 level, you can go for buy or sell trade.
From below example, you can see that when price comes to support level and ADX crosses 20 levels and went up, there is strong up movement in stock price.
When the price breaks the support level and ADX cross the 20 level, the strong down trend starts.
For the sell trade, when the price breaks the support level and ADX cross the 20 level, the strong down trend starts.
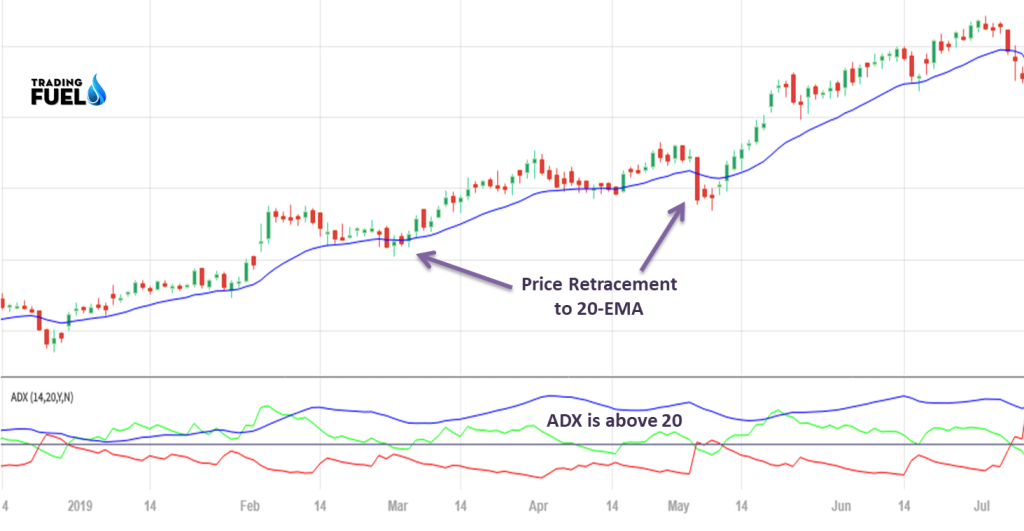
ADX Pullback Strategy
In this strategy, first apply 20- Exponential Moving Average (EMA). Now, first confirm that the stock price is in the uptrend and ADX is above 20. Now when you find out pullbacks in the stock price towards the 20- EMA, you can go for the trade with the trend.
Let’s have a look on the example based on this strategy.
You can see that there is a strong uptrend and the ADX is above 20. At the pullback, when price comes towards 20-EMA, you can go for buy trade.
ADX Divergence Strategy
When the price goes up and ADX moves down or prices moves downwards and ADX moves upward at the same time, the divergence occurs.
Example:
From the below image, you can see that the stock price is going upwards making new highs but at the same time the ADX is falling (but above 20). This indicates that the uptrend is getting weaker and going to end soon.

ADX Reversal Pattern
This strategy is most useful strategy with the use of ADX. In this strategy when the +DI line breaks the previous high of –DI line, during the ending of down trend, it indicates that buyers are getting control and you can go for buy trade. You can also use this strategy to exit your trade at the right time.
Same for the sell trade, let’s understand it with the below example.
Here you can see that the –DI line broke the previous high of +DI line and at the same time there is a down trend in the price.

Average Directional Index Setting
The default setting of ADX is 14 days or bars. As per your convenience, you can change the settings to as low as 8 and as high as 50.
As the time period setting increases, the responsiveness of ADX decreases. If you set the lower time period, you will get trends earlier but it may go wrong. Same for the higher time period setting, you will get more reliable signals but it gives new trends rather late than early.
How to Use Average Directional Index for Intraday Trading?
For intraday trading, the best entry comes in a trade when the ADX is above 25 and going upwards. At the 25 value, there are lots of strong trend, but it doesn’t work like always. So, it is better to use stop-loss always.
As an intraday trader, ADX is a very helpful indicator for Finding Trends. You can find the extremely active intraday moves with the help of this indicator. The combination of ADX indicator and Bollinger Bands gives the best result in your day trading.
To be a professional and successful trader, it is important to understand that when the trend is starting, the strength of a trend and when it is ending. This is very important for every trader because trend is a key for profitable trading and this will help you to maximize your profitable trades.