Traders only use Most Accurate intraday trading indicators for Intraday Trading Setup. Whether a trader is a beginner or an experienced, indicators are important. It helps you plan your trading for the maximum returns. Referring to the intraday trading tips, charts, and indicators is a common way.
Day trading indicators minimize the risk level. The indicators provide useful information on market trends. This post guides you to understand the best indicator for intraday trading. As a thoughtful investor, you also need to decide how much you want to rely on the indicators.
How to Use Indicators?
Day trading indicators provide good guidance. The most useful information from indicators is here. Traders use it for assessment of the market scenario before trading.
- The Direction of the current market trend
- Momentum in the investment market
- Chances of profit
- Volume assessment to know the popularity of the market
- Demand and supply trading theory
The crux lies in finding the right mix of the indicators for profitable decision. Too much of information might spoil the strategy. Use always the best combination of indicators for intraday trading.
Top 5 Intraday Trading Indicators For Setup
Not all traders prefer to use the indicators. If you use, pick the most suitable and useful. The below list contains some common ones.
Oscillators
Oscillators type of indicators reflects up and downflow. Popular oscillators are Stochastics, CCI or Commodity Channel Index. Others are MACD and RSI.
Volume
Volume indicators are a mix of price data with volume. They determine how strong the trends in terms of prices.
Overlays
Overlays indicators are Moving Averages and Bollinger Bands. Parabolic SAR and Fibonacci Extensions are other Overlays. Moving average determines trends. Fibonacci is to plan profit targets. CCI have a good number of uses like trends and trade triggers.
Breadth
The Breadth Indicators are stock market-related. The major ones are Ticks, Tiki, Trin and also the Advance-Decline line. They relate to the sentiment of the traders. They reflect what the large part of the market is doing.
Bollinger Bands
This comprises three lines. The lines show the moving average, lower limit, and the upper limit.
How to Read Indicators?
Using many indicators is not a good idea. Pick the one among the most useful ones. Also, use the one that you can read well. Find here an easy way to understand the most popular tools available.
The Traders Also Like: How to Select Stock For Intraday Without Chart?
1. Moving Averages (M.A.) :
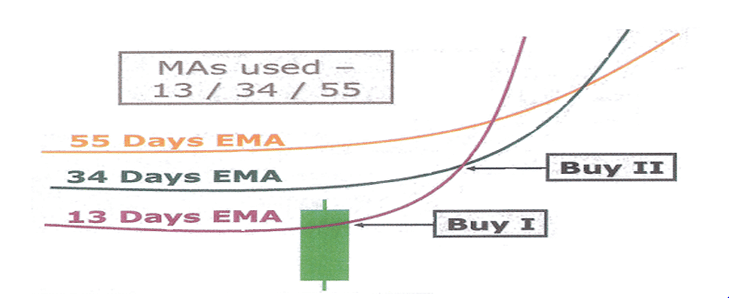
The market trend is bullish when the long-term averages are less. It is bearish when short-term averages are less. This helps traders to earn indecent profit in intraday. Its very Simple Intraday Trading System.
Uses of Moving Average
- To find the trend, either up or down
- To know the reversal of the trend
- To find out the stop loss and trailing stop loss
- To find out the price overextended
Basic Buy signals for MA
- Moving average should almost be parallel and at equal distance
- They should be in ascending order
- Lowest Ma is at the bottom while the highest Ma is at the top
- The first signal gets generated when the price cuts the short ma from the bottom
Basic Sell signals for MA
- Moving average should almost be parallel and at equal distance
- The moving average should be in the descending order
- The first signal gets generated when price cuts the higher Ma from the top

2. Moving Average Convergence Divergence (MACD) :
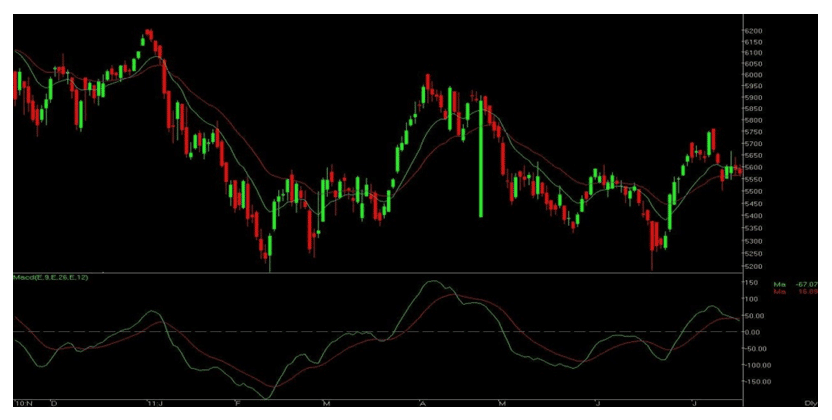
MACD is used to identify the different aspects of the overall trend. These aspects are momentum, trend direction, and duration. MACD takes the difference between two lines as a histogram and oscillates above and below center zero line.


3. Bollinger Bands (B.Bands) :
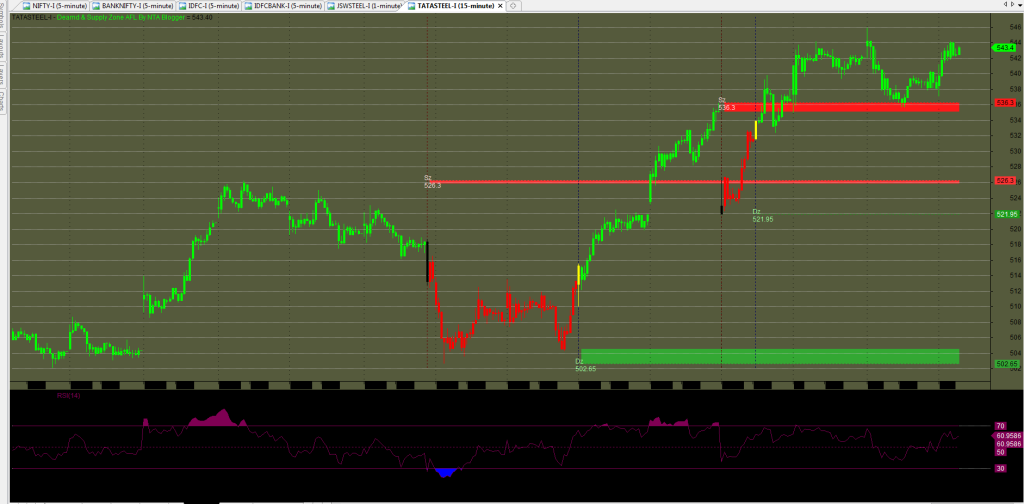
The price may go up in some time if the stock trading price is below the lower line. Traders decide to take a buy share strategy.
- The band may be at high or Low.
- It uses Band Bollinger Demand and Supply Zones.
- Always Buy in demand zone with lower band touching the price at Support.
- Sell In supply zone with higher band touching the price at Resistance.
You Also Like: The Best Intraday Trading Strategies
4. Relative Strength Index (RSI) :
when RSI touches 70, selling the stock is good. Vice versa, buying is good when it RSI goes down to 30. Yet, a stock-specific study is important.
- This indicator is known as Momentum Indicator.
- RSI indicates that the price is Oversold or Overbought.
- RSI compares the price Between Advancing period and Decline period.
- The Common parameter is 14 period.


Every Trader Must Know: All Time “Best Intraday Trading Techniques “
5. Average Directional Index (ADX) :
ADX is used to quantify the strength of the trend. ADX calculations are based on a moving average of price range expansion over a given period time. The default setting is 14 bars, although other periods can be used.
- This Indicator is Momentum Indicator.
- Reading between 0 to 100
- Below 10 to 15 indicates the consolidation.
- > 25 reading indicates the strength
- Calculated from +di and –di

Indicators are not a proven way to earn profits. They are good to read the market moods for the best investment decisions.
If you are looking for intraday trading indicators then this Article is 100% Helpful for Your Intraday Setup.
About Us
In this blog, you will get to know about the Intraday Indicator and how it works in the share market. Trading Fuel provides information about the vast topics of the stock market and we keep on updating our site with new blogs. Finance itself is the vast topic to know, in the stock market no-body know the complete finance but they keep on learning and making themselves educate by applying the learning. You can read more from this blog and make yourself updated.

