
Bullish Engulfing Pattern Trading Strategy Guide:
Bullish Engulfing Pattern (Candlestick Formation)

- For a bullish engulfing pattern formation, the bullish sentiment of the current day completely overcomes the bearish sentiment of the prior day.
- The bullish engulfing candle is a reversal pattern that confirms the dominance of the buyer over the seller and indicates a potential reversal in the trend direction.
- It is a two- candlestick pattern.
- The 1st candles signify that the seller has the upper hand during the whole trading day, and pushes the price lower.
- And the 2nd candles signify that the buyer has completely dominated the seller of the previous day and pushes the price higher.
- For a genuine trend reversal set up the volume in the 2nd bullish candle must be very high, indicating significant buying in the stock.
What is inside a Bullish Engulfing Pattern, how it form?
- Inside of bullish candle in lower time frame:
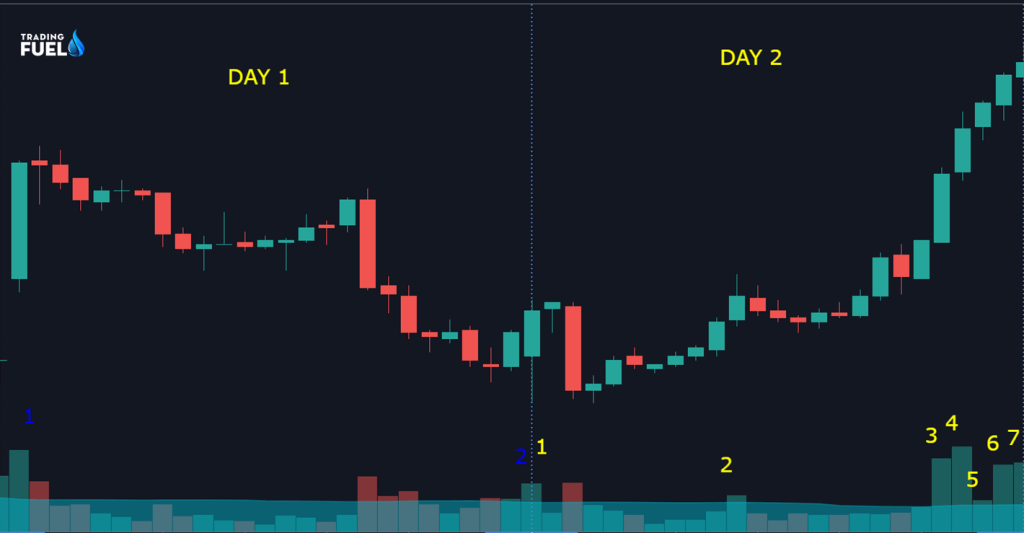
- Day 1 is the 1st-day candle, which was a big bearish candle in a daily time frame.
- The whole day seller has pushed the price down.
- Seller volume dominated the buyer volume
- Only 2 bullish candles volume is above the 50 period average of volume.
- Day 2 is the 2nd-day candle, which was a big bullish candle in a daily time frame.
- The whole day buyer has pushed the price up.
- Buyers volume dominated the sellers volume
- Here 7 bullish candles volume is above the 50 period average of volume indicating the participant of a major player in the up move.
- Bullish engulfing candle in a higher time frame:
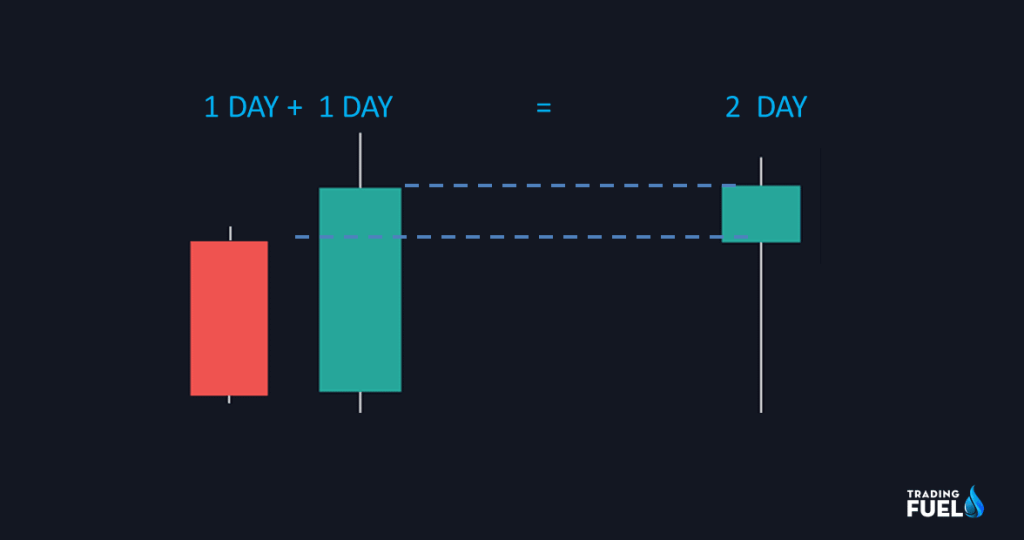
- In a higher time frame, two candles of daily period form hammer in a higher degree time frame of 2 days.
- Hammer is a very powerful candle indicating the rejection of price, and dominant of the buyer.
What does a bullish candle represent?
- The bullish engulfing candle gives a strong signal when showing up at the bottom of a downtrend and demonstrates an increase in purchasing pressure.
- Bullish engulfing often results in a reversal in trend, as move buyer enters the market and pushes the price higher.
- Bullish engulfing candle confirms with the increase in the volume provide an initial base for future uptrend movement.
- If a bullish engulfing candle forming near a support or at some technical level of indicator, the possibility in trend reversal further increases.

Engulfing candles multiple uses?
Engulfing candles can help you to identify a possible trend reversal, indicate the strength of the move, and also help is identifying exit points.
- Reversal:
Spotting reversal, as you all know market moves in trend, in an up-trending majority of trader will seek to buy at a pullback, but no one know at which level will the pullback will end, so by spotting engulfing candle in a pullback we can time the market at a possible reversal level.
- Trend continuation:
A trader can look at the bullish engulfing candle during an uptrend, which provides more conviction that the uptrend is likely to continue.
- Exit system:
The bullish engulfing candle can be used as a signal to exit a short trade. If you are holding a short position and after a fall in the market you see a bullish engulfing pattern it is better to book profit.
1. How to Trade a Pullback?
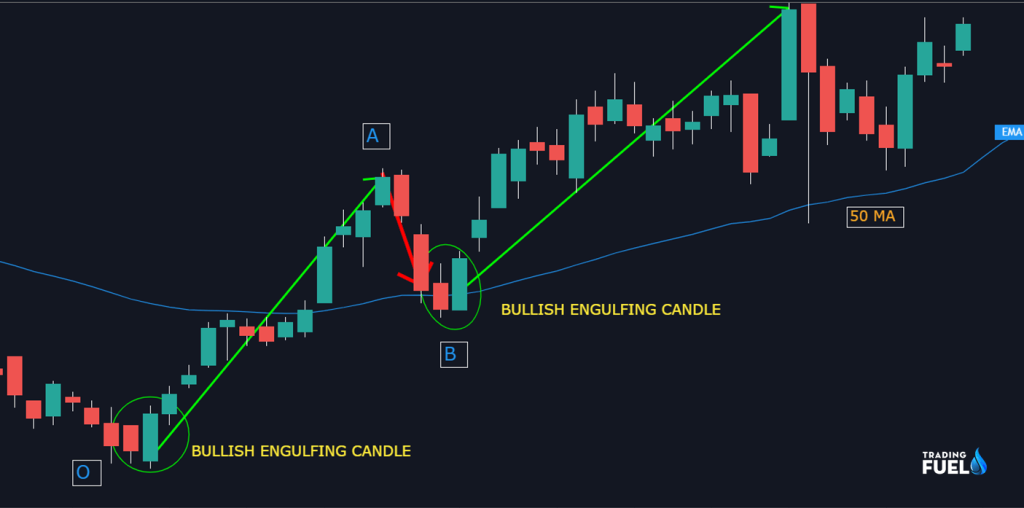
- Here bullish engulfing candle forms at point O and point B
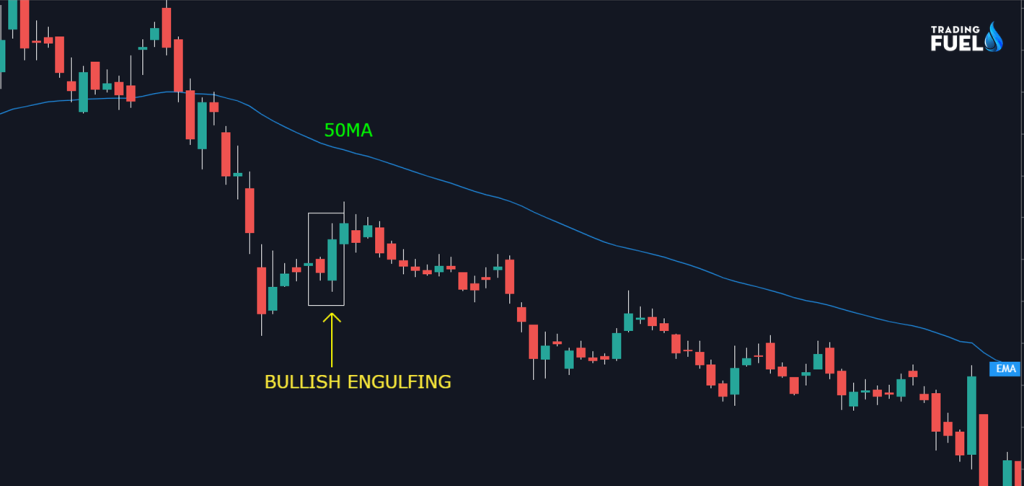
- Entering at point O is not favorable, as share was is in a downtrend and has no prior support below.
- After share has moved from O to A, then pullback came at point B
- Formation of bullish engulfing at above 50 MA is a confirmation 50 MA is acting as support.
- After which we can enter into a trade.
- Keeping stop loss below the low of point B
2. How to Catch the Market Bottom?
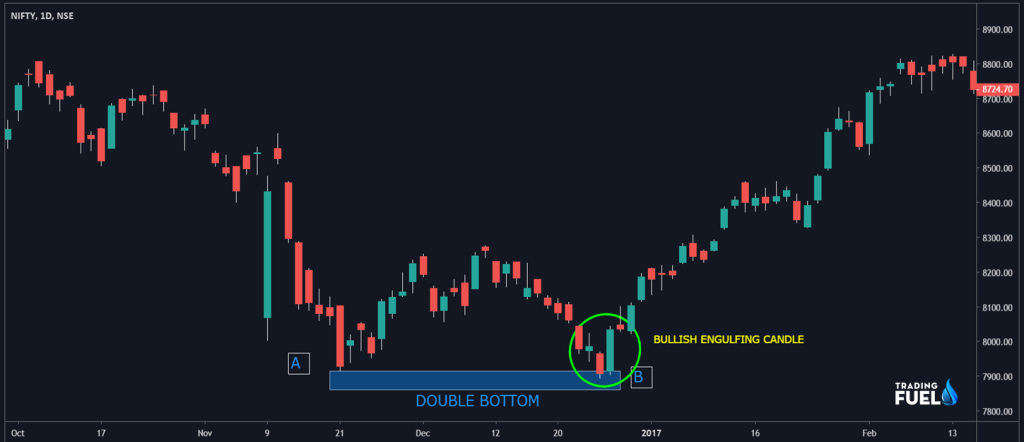
- There are several price action patterns like head & shoulder, wedge, triangle, double bottom, and many more.
- Here we have discussing double bottom pattern, in this pattern as shown in the image above the period leg acting as a support.
- And the formation of the bullish engulfing pattern at such an important level, we give us good trading opportunities.
- This is a chart of nifty of December 2017, after this bullish engulfing pattern market started its new uptrend.
3. How not to trade a bullish engulfing candle?
- If the market is in a genuine downtrend, and there is no prior support level available for the price then blindly looking at a bullish engulfing pattern is a mistake.
- If an overall trend is down, it is because of players of the market are betting against the share.
- Big players cause heavy selling pressure with high volume.
- If you are buying share after a bullish engulfing candle occurs under such condition, it will result in a loss.
- Just think how a one-day bullish candle can overcome such a heavy downtrend.
- You can’t make money betting against the big player in the market.
- Well, there are cases when prices do tend to reverse sharply, after the formation of bullish engulfing candle even in a downtrend but there probability of success is very less.
- As a novice trader is it better to look for a high probability setup.
Mistakes to avoid while trading bullish engulfing
- Trading bullish engulfing signal without understanding the different market condition will cost you.
- If you are using a bullish engulfing signal for entry without using any other confirmation signal, then you haven’t understood the market behavior otherwise you won’t do such a silly mistake.
- What seems to be a bullish engulfing candle in a higher time frame will just be a retracement of the previous downtrend after which the trend will continue in its original path.
- If you are only focused on price without realizing the importance of volume in bullish engulfing candle then you wouldn’t be able to identify a fake bullish engulfing candle and fall into a trap.
Tips:
- To be a valid candle, the 2nd-day bullish candle must completely engulf previous day candle range
- We can time the market better as Engulfing candle provide us good opportunities to time the market, and enter before momentum started.
- Only higher time frame candlestick patter should be considered like daily or weekly, lower time frame candela are more susceptible to noise
- To be called a valid engulfing candle it must form after a downtrend having an exhausting volume.
- Engulfing candle must break the eminent resistance zone with high volume, otherwise is not considered a valid signal
- 50% retracement of the engulfing will provide us higher risk-reward opportunities.
How to enter at 50% retracement of the engulfing candle?

- First let a bullish engulfing candle for after a downtrend
- Here day 1st bearish candle looks like a hammer,
- Day 2nd bullish candle completely engulf the prior day candle, so it is a valid engulfing pattern
- Draw a Fibonacci level from LOW to HIGH of the bullish candle.
- If the price came near this 50% level in the upcoming day, it will provide us a low-risk entry.
- We can keep stop loss a few points below, the lowest low of the two-day candle.
Cautionary notes:
- Engulfing candle won’t occur after every pullback, which means you are gonna miss lot of trading opportunities to overcome this you can use engulfing of multiple candles example after a pullback in an up-trending market, take multiple candles to engulf period candle
- An engulfing candle will not always signal a trend reversal that is why we should always use stop loss.
- The engulfing candle can occur in a downtrend, and any up move may turn out to be a retracement of the current trend, rather than a trend reversal.
- If you are directly applying the rules of engulfing candles in a shorter time frame your stop-loss is likely gonna hit. Candles forming in higher time are more reliable.
Conclusion:
In this blog we have discussed the bullish engulfing candle formation, what kind of market sentiment does it represent where to look for a bullish candle, precaution to be used, does, and don’t regarding the application of the bullish candle. It is an easy concept for a beginner to understand. After understanding the basics of different candles and the reason behind their formation then only you can read and understand the chart of any share.
Contain ©️ Copyright By, Trading Fuel Research Lab