
There is constant demand and supply trading in the Stock market. If you look at the depth of the market you will be able to see the order to buy and sell at different prices. Such numbers show demand and supply trading. How to identify supply and demand zones on a chart ? all detail are below with simple strategy for find demand and supply trading.
Demand and Supply Trading ⇒ “Demand Zone” :
At Demand Zone, Buyers are dominated to buy and Sellers are weak.
At Demand zone, Massive Buying pressure.
DEMAND ZONE ADVANTAGES
- There is minimum risk
- There is high profit potential
- The probability for right trade is high
- Very easy to identify the area
- The risk to reward ratio is more
How to identify demand zone ?
- First of all look at the chart
- Look at the left hand side of previous low where the previous strong rally started
- Find out the origin or start point of the strong rally
- Draw two parallel lines: 1st line at low and 2nd line at nearest close

1.Price Comes in Demand Area

2. Reversal Candle In Demand Area
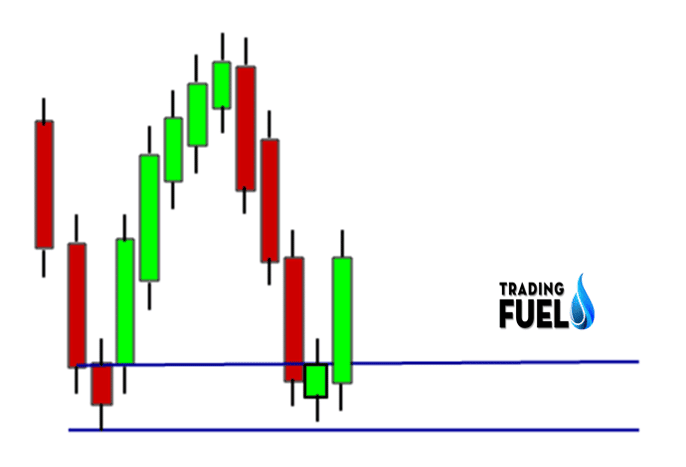
3. Reversal Candle Breakout

Example Chart of Demand Zone
Demand and Supply Trading ⇒ ” Supply Zone ” :
At supply Zone, Sellers are dominated to sell & Buyers are weak.
At Supply zone, Massive selling pressure.
Main advantages of selling in supply zone:
- Minimum risk
- High profit potential
- High probability for Right trade
- Very easy to find out the area
- Risk reward ratio is more
You Also Like: Intraday Trading Strategies
How to find out supply zone
- First of all look at the chart
- Look at the left hand side of previous high
- Where the previous strong down trend starts
- Find out the origin of the strong down trend
- Draw two horizontal parallel lines 1st line at high and 2nd line is at nearest close.
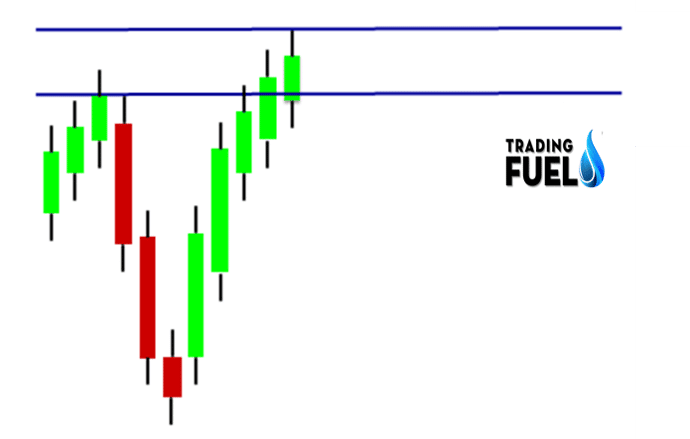
1. Price Comes in Supply Area
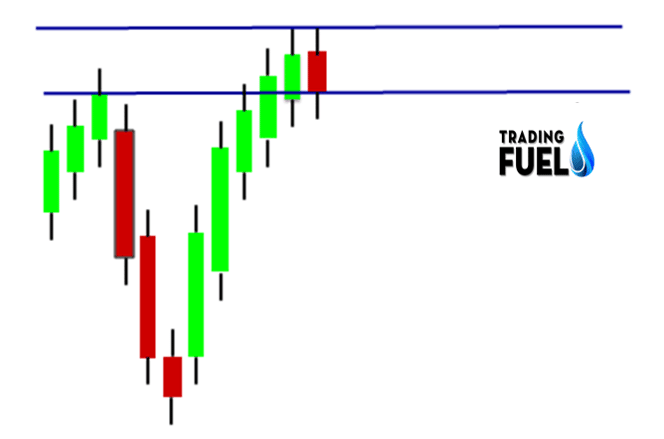
2. Reversal Candle in Supply Area

3.
Example Chart of Supply Zone
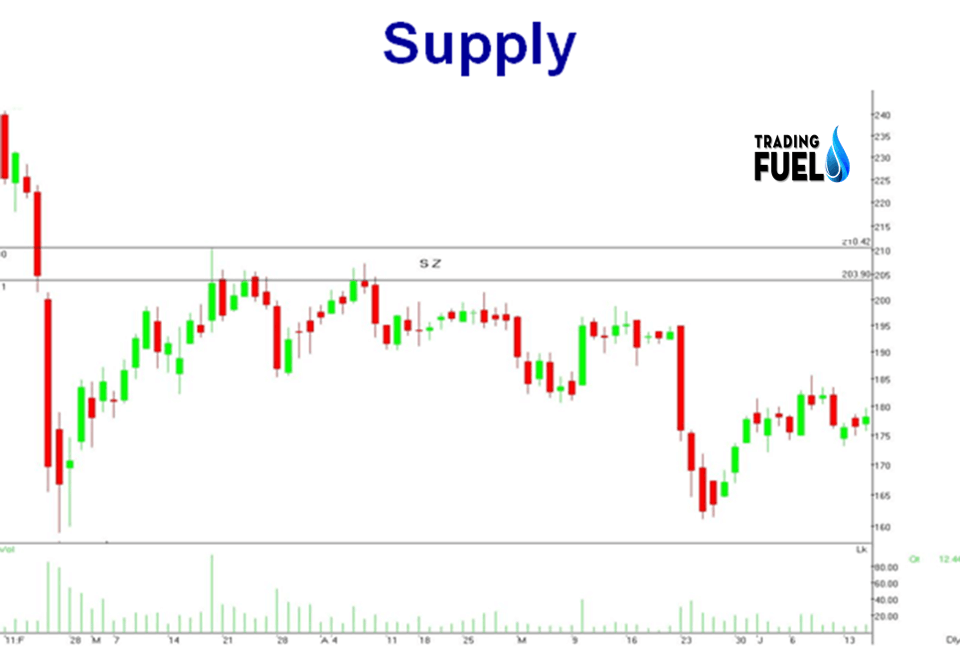
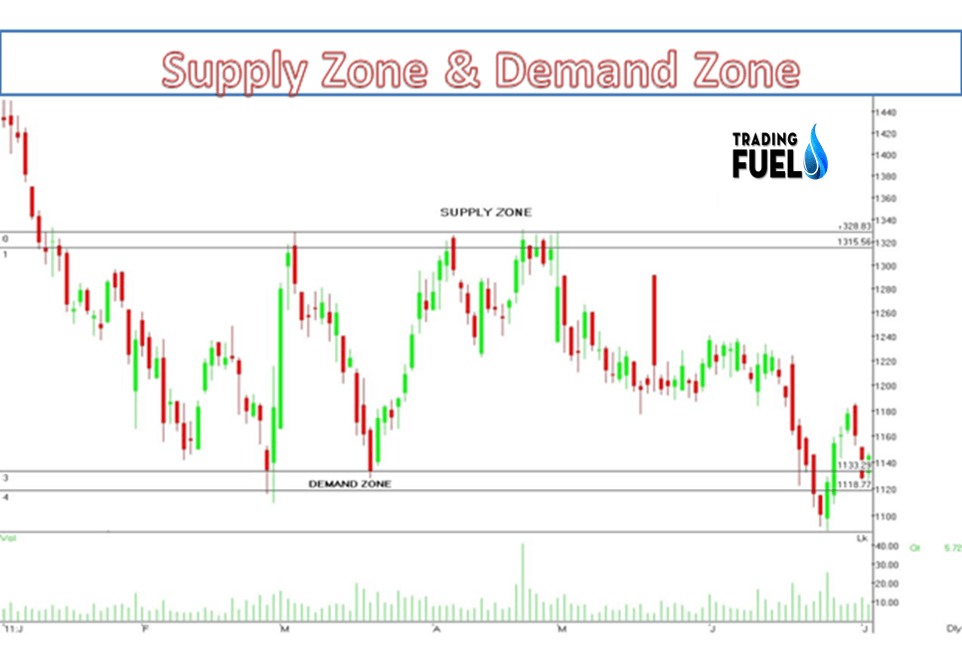
Example Chart of Demand and Supply Trading Zones
Trading Foundation
| Right Entry | Trend | Pattern | VOLUME | M. A. |
| Buy at Demand Zone
Sell at Supply Zone. Always Put SL. Take Confirmation. | Find out Nifty trend.
Find out stock with same Direction Always Trade Active stocks. | Find out Patterns either Bearish or Bullish.
for Greater Profitability. | Always check Volume at Demand and Supply Zone.
And Break out of bar. | Always shows the Strength and direction of stock or Index.
Use for Stop loss. |