Introduction to Elliott Wave Theory
- Elliott Wave Theory Was Developed By The Ralph Nelson Elliott In the Year 1930. After Studying Dow Theory Approach That Market Moves In Waves. He Observed Different Pattern Which Is Occurring Within Wave And Come Up With His Theory Of Elliott Wave, In Which He Has Described All Possible Wave And Theory And Punished A Book “Elliott Wave Principle” In 1938,
- Elliot Believed That As Market Seems To be Behaving In A Random And Chaotic Manner But It Not True. He Had Observed That Market Is Behaving In A Repeating Pattern Which May Or May Not Be Equal In Time And Amplitude But Structure Of These Patten Are Same In Any Time Frame Which Provides More Scientific Approach To The Trader/ Analyst.
What Is Elliott Wave Theory
Form Elliott Wave Perspective The Plotted Price Activity Is The Graphical Representation Of Crowd Phycology, Once Certain Physiological Mood Has Run Its Course People Tend To Get Bored With An Idea And Grab A New One. Elliott Wave Theory Organizes Random Flow Of Market Price Action Into An Identifiable, Predictable Pattern Based On Natural Progression Of Crowd Psychology. Price Of Any Share Does Not Vertically Go Up Or Go Down. If Share Has To Go In Any Direction It Does So In Waves. Ralph Nelson Elliot In His Theory Come Up With A Detailed Description Of These Waves, Description About Their Moves, Location, Personality, Behavior, Structure, Rules And Guideline For Proper Calculation Of The Wave.
Rule of Game:
There Are Three Main Rules For Elliott Wave Counting, Are As Follows:
1. Wave 2 Never Retrace More Than 100% Of Wave 1.

2. Wave 3 Can Never Be The Shortest Of Three Impulse Wave.
3. Wave 4 Does Not Cross The Final Point Of Wave 1 Except In Diagonal.

These Are The Three Basic Rules Of Elliott Waves And Must Not Be Broken At Any Condition While Counting Wave Any Rule Is Broken Then We Are Surely Wrong In Our Count.
Wave Degree:
All Wave Can Be Categorized By Degree. Elliot Derived Nine Degree Of Waves From Smallest To Largest, He Chooses The Name Listed Below These Degree From Largest To Smallest Degree.
- Grand Supercycle: Multi Century
- Super Cycle: Multi Decade
- Cycle: One Year To Several Year
- Primary: Few Month To Couple Of Years
- Intermediate: Weeks To Months
- Minor: Weeks
- Minute: Days
- Minutte: Hours
- Subminnutte: Minutes
Cycle Wave Are Subdivided Into Primary Wave That Subdivided Into Intermediate That In True Subdivided Into Minor And Sub- Minor Waves. By Using This Nomenclature We Can Identify The Precisely The Position Of Wave
Wave Concept of Elliott Wave Theory
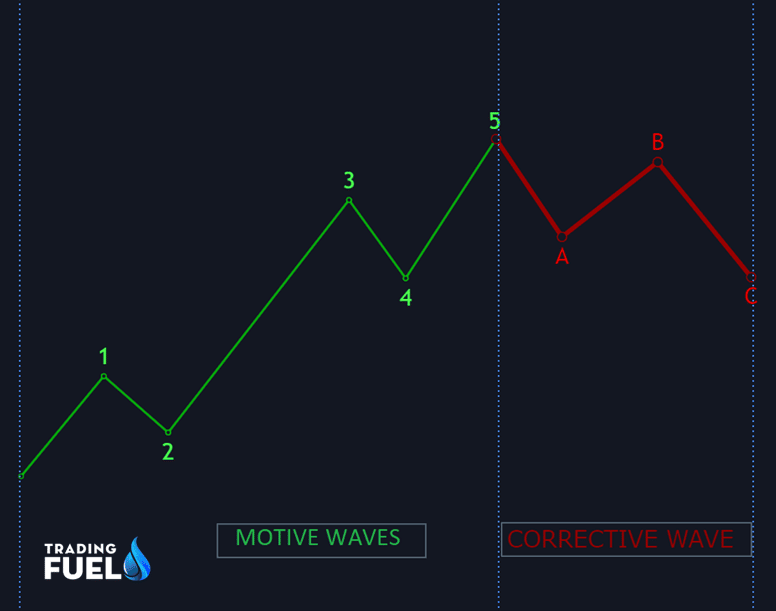
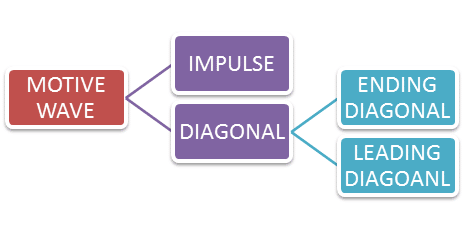
- Motive Wave: Motive Wave Subdivided Into Five Waves With Certain Characteristics And Always Move-In Same Direction Of One Larger Degree, Motive Waves Can Be Further Classified As “Impulsive Wave” And “Diagonal Triangle”. Motive Waves Are Easy To Identify especially Impulse. Because Of Their Simple Structure And Easy Rule To Plot Them.
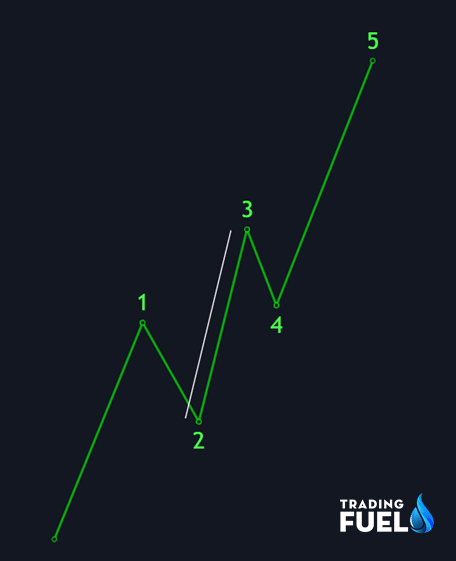
1. Impulse Wave: The Most Common Motive Wave Is An Impulse Wave, In Impulse Wave, The Wave1 Does Not Overlap With The Wave 2 Under Any Condition, In Addition To This The Sub waves Of An Impulse (1,3,5) Are Motive In Nature especially Wave Which Is Always An Impulse. It Is Always In Direction Of The Trend. Sub Waves Are In Pattern Of (1-2-3-4-5).

2. Diagonal Triangle: Diagonal Triangle Is A especially Type Of Motive Wave Which Mostly Occur In Wave 5. When The Previous Wave 3 Have Gone Too Far Too Fast. A Very Small Percentage Of Diagonal Wave Are Appear In C Of A-B-C Correction. Diagonal Take A Shape Like A Wedge Where Two Line Are Converging Diagonal Waves Are Subdivided Into Two Different Type, Depend Upon Their Location.
a. Ending Diagonal: Wave 5 and Wave C Is Likely To Be Ending Diagonal With Sub Waves Of Structure (3-3-3-3-3) And Markets As 1-2-3-4-5, It Represent Lack Of Strength Of Up Move, As A Result Of This Lack Of Strength Wave 5th Is Shorter Having Internal Structure Of (3-3-3-3-3) It Means The Bull Are Losing Steam And Trend Is Likely To Be Reverse After The 5th Wave Finally Complete.
b. Leading Diagonal: It Is Likely To Occur In Wave 1st Or Wave A With Sub Waves Of Structure (5-3-5-3-5) If Wave 1 Is Of Leading Diagonal Then Wave 3 Is Likely To Be Extended.
Sub wave Are Waves Of Lower Degree.
| Motive Waves | Wave Sequence | Labeling |
| Impulse | 5-3-5-3-5 | 1-2-3-4-5 |
| Diagonal Leading | 5-3-5-3-5 | 1-2-3-4-5 |
| Diagonal Lagging | 3-3-3-3-3 | 1-2-3-4-5 |
- Corrective Wave: As Name Suggest It Is Wave Which Is Against The Trend Of One Higher Degree. Resistance From One Higher Degree Appears To Prevent A Correction From Developing A Full Motive Structure. This Struggle Between Two Opposite Trending Degree Makes Corrective Wave Less Identifiable Than Motive Waves. For This Reason, It Is Difficult To Correctly Label A Correction Until It Is Over. One Should Must Exercise Correction Wave Counting With More Caution.
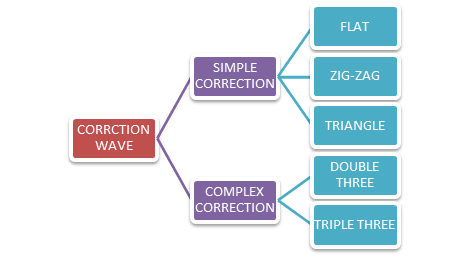
- Corrective Wave Are Further Classified As
1. Flat Correction: It Is A-B-C Pattern Having Sub Waves (3-3-5), Wave A=3, Wave B= 3.Wave C=5.It Mostly Occurs At Wave 4. Here C Wave Will Terminate Or Surpass The Low Made By Wave A. It Is A Brief Correction In Term Of Price Flat Are Also Of Three Different Type Depend In The Location Of C Wave.
- Regular Flat
- Irregular Flat
- Running Flat

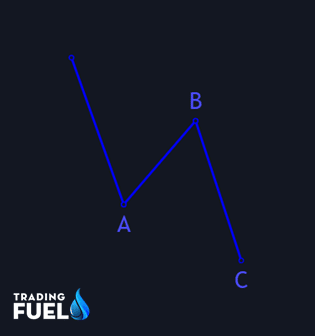
2. Zigzag Correction: It Is A-B-C Pattern Having Sub Waves (5-3-5), Wave A=5. Wave B= 3, Wave C=5, It Mostly Occurs At Wave 2 .C Wave Will Surpass The Low Made By Wave A. It Is A Deeper Correction In Term Of Price. Here Wave C Is Likely To Be Equal To Wave A.
3. Triangle: Triangle Reflect The Balance Force Causing A Sideways Movement With Decrees In Volume And Volatility. It Consist Of 5 Overlapping Wave With Sub Waves (3-3-3-3-3) And Labelled As A-B-C-D-E, It Can Be Easily Spotted And Its Breakout Can Be Traded In The Direction Of The Major Trend More Easily Than Trading Any Other Pattern, Most Likely To Occur In Wave 4.

4. Double Three: It Is Combination Of Two Simple Corrective Pattern It Could Be Two Flat.Two Zigzag Or Flat And Zigzag Or Combination Of Triangle With Flat Or Zig-Zag. Here Two Corrective Pattern Are Connected Through 3 Wave A-B-C Denoted By X. Double Three Is Represented By X-Y-Z.
5. Triple Three: It Is Side Wave Combination Of Corrective Pattern. It Is More Of A Time Wise Correction Then Price Wise. Represented By W-X-Y-X-Z Here. It Is A Combination Of Three Simple Corrective Pattern (Flat+Triangle+Ziz-Zag) Like This There Any Many Possibility Of Triple Three Corrective Pattern Structure.
| Correction Waves | Wave Sequence | Label |
| Flat | 3-3-3 | A-B-C |
| Zig-Zag | 5-3-5 | A-B-C |
| Triangle | 3-3-3-3-3 | A-B-C-D-E |
| Double Three | 3-3-3 | W-X-Y |
| Triple Three | 3-3-3-3-3 | W-X-Y-X-Z |
Advantage of Elliott Wave Theory
MULTIPLE BENEFIT:
Long Term Benefit Of Elliott Wave Are Numerous. As An Investor Or Trader One Can Frequently Anticipate Major Change In Economic Environment. In Such Know Condition One Can Protect His Gain And Also Profit Form Such Change In Trends.
HELPFUL INDICATOR CLARIFICATION:
If One Decide To Use Another Indicator In Conjunction With Elliott Wave Theory. The Theory Help Him To Anticipate When And Where That Indicator Is Likely To Fail.
SIGNAL INFREQUENT BUT RELIABLE:
Only After An Identifiable Pattern Is Complete It Is Safe To Enter A Market. It Helps To Avoid Overtrading And Prevent Entering The Market When There Is Little Potential.
It Is One Of The Tool Which Is Forecasting In Nature. All Other Indicators Are Lagging As They Only Give Average Value Of Past Data In Some Aspect.
Limitation
COMPLEXITY:
Elliott Wave Theory Is probably The Most Complex and Lengthy Theory.It required a Lot Of Time And Practice To Master. The Theory Take More Time To Perfect Then Most Of the People Are Willing To Commit.
YEAR TO MASTER:
There Are So Many Rule And Guideline In Elliott Wave If Would Probably Take Year Just To Understand Theory And Another Year To Effectively Apply Elliott Wave And Master It. Extreme Complexity Of Elliott Wave And Demanding Nature Of Wave Theory Prevent Most People From Pursuing This Area Of Analysis.
MEMORIZATION:
Large Amount Of Information Needed To Memorized Order To Apply Elliott Wave Theory, If One Forget Or Wrongly Interpreted A Technique Whole Wave Count May Be Wrong And Our Trade Is More Based On Luck Then Scientific Approach.
What Make Elliott Wave Theory More Unique
Complete perspective: Unlikely Most Of System Elliott Wave Theory Allow Us To Analysis Any Time Frame Hourly, Daily, Weekly, Monthly, Year Etc. Even More Interesting Studying All Time Frame Simultaneously So We Can Easily Understand How Bigger Time Frame Is Affecting The Lower Time Frame Move.
Detailed categorization: Elliot Allows Categorization Of Move Which Cover Just A Few Seconds In Length To Hundreds Of Year.If We Know What Type Of Pattern Is Unfolding Then We Can Have A Better Idea Of What To Expect From The Move In Term Of Speed, Complexity, Volume, Time.