
Fibonacci Trading History:
Fibonacci Trading and Retracement: The Fibonacci number series and therefore the properties of this series were made famous by the Italian mathematician Leonardo de Pisa.
The Fibonacci number series starts with 0 and 1 and goes bent infinity, with a subsequent number within the series being derived by adding the prior two.
For example: 0, 1, 1, 2, 3, 5, 8, 13, 21, 34, 55, 89, 144 . . .
What are Fibonacci levels and the Fibonacci tool?
Fibonacci levels are the key ratio that appears in various things such as leaves, flowers, and petals and is followed by several naturally occurring various things. Such key ratio is key Fibonacci ration are 23.6%, 38.2%, 50%, 61.8% and 100%.
The Fibonacci tool is used for potential retracement and extension levels of the price of any financial asset including stock, future, currency, and commodity.
Fibonacci tools use horizontal lines to highlight the area of support and resistance at the key Fibonacci level which either can be in a downtrend or an uptrend.
These levels are created by drawing a trend line between two extreme points and dividing them horizontally based on the Fibonacci ratio, the key Fibonacci ratios are 23.6%, 38.2%, 50%, 61.8%, and 100%.
A term used in technical analysis that refers to the area of support or resistance.
The Fibonacci number and golden ratio:

In the relationship between the numbers of the Fibonacci series, you will find that they are differed from each other by a ratio of 1.618, which is called the Golden Ratio.
it is important for many traders to apply these ratios in the current price action move of an asset so that it can help them to identify various support and resistance levels in the price, and therefore they can pinpoint key levels for entry and exit.
support is a price area where the current price will look for the possible halt or termination of a downtrend and it also provides a trading opportunity where you would consider buyer or selling depending on the market you are analyzing.
Resistance is a price area where the current price will look for the possible halt or termination of an uptrend and it also provides a trading opportunity where you would consider selling or buying depending on whatever market you are analyzing.
Fibonacci Price Retracement:
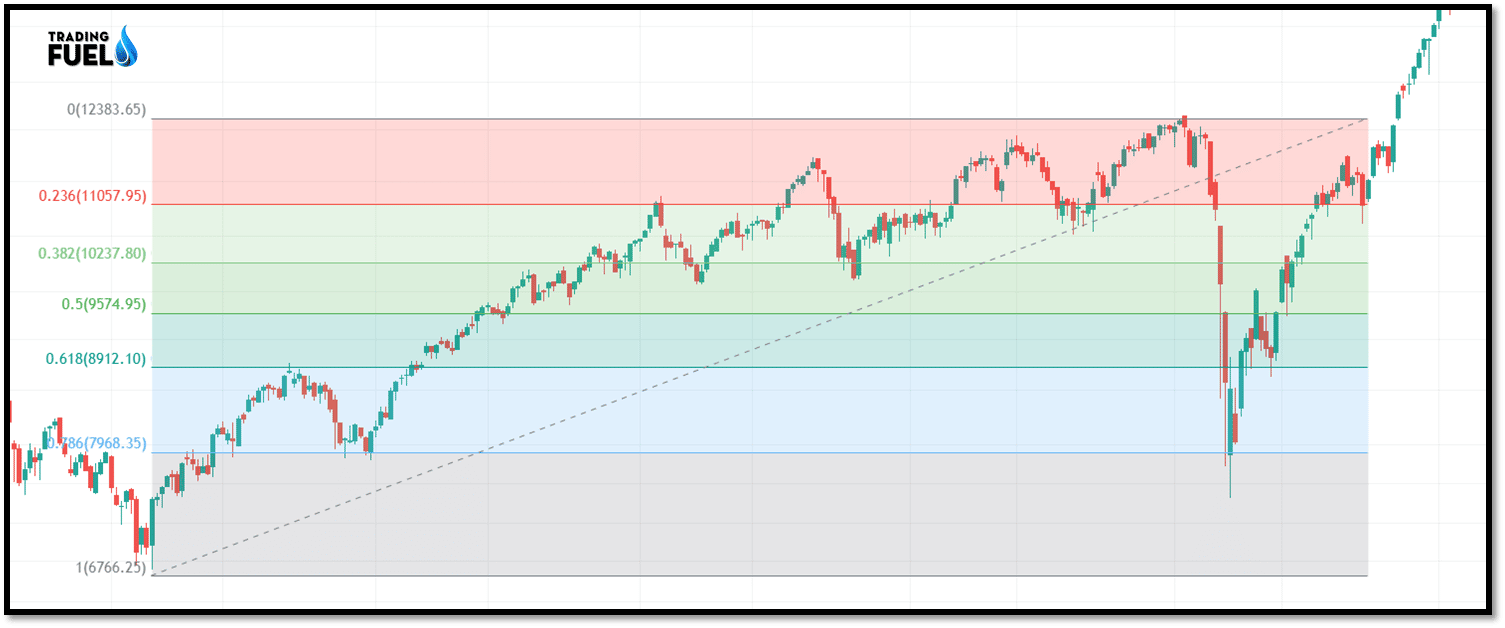
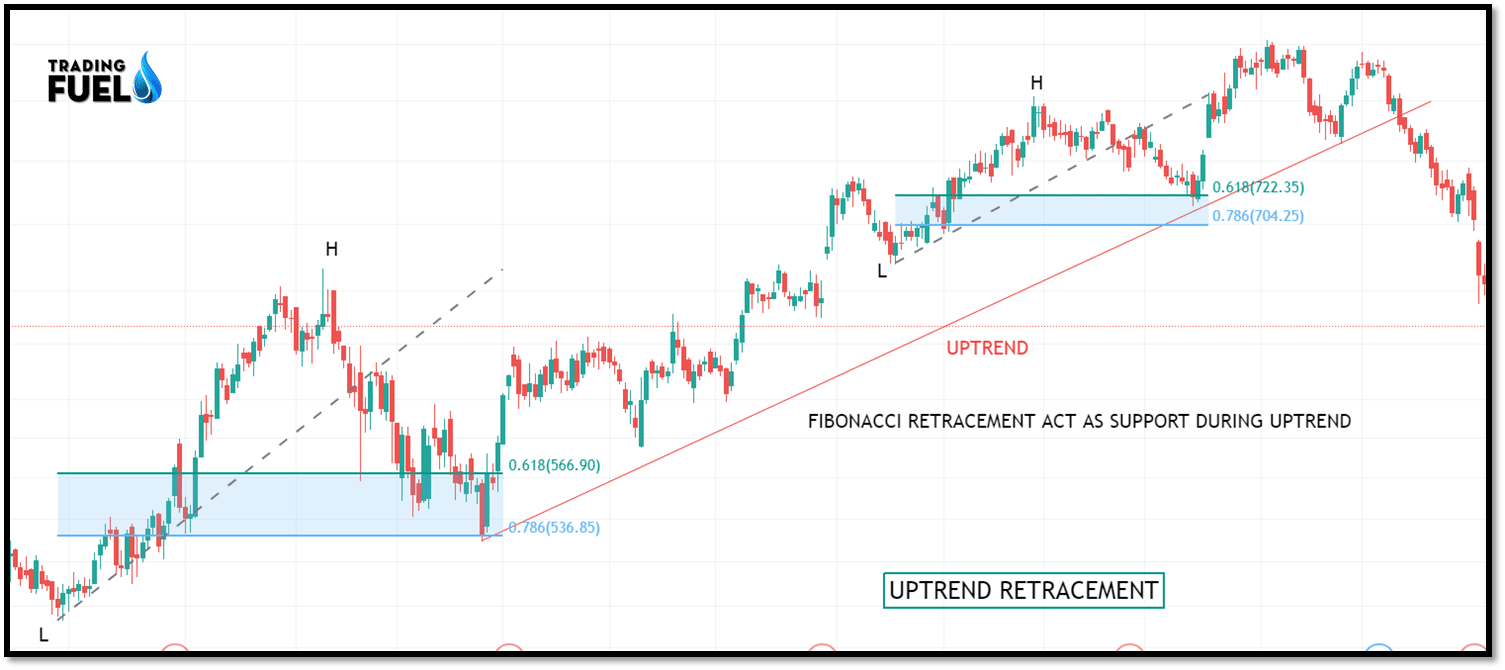
Fibonacci retracement uses horizontal lines to indicate the area of support and resistance at the key Fibonacci level before it continues its trend.
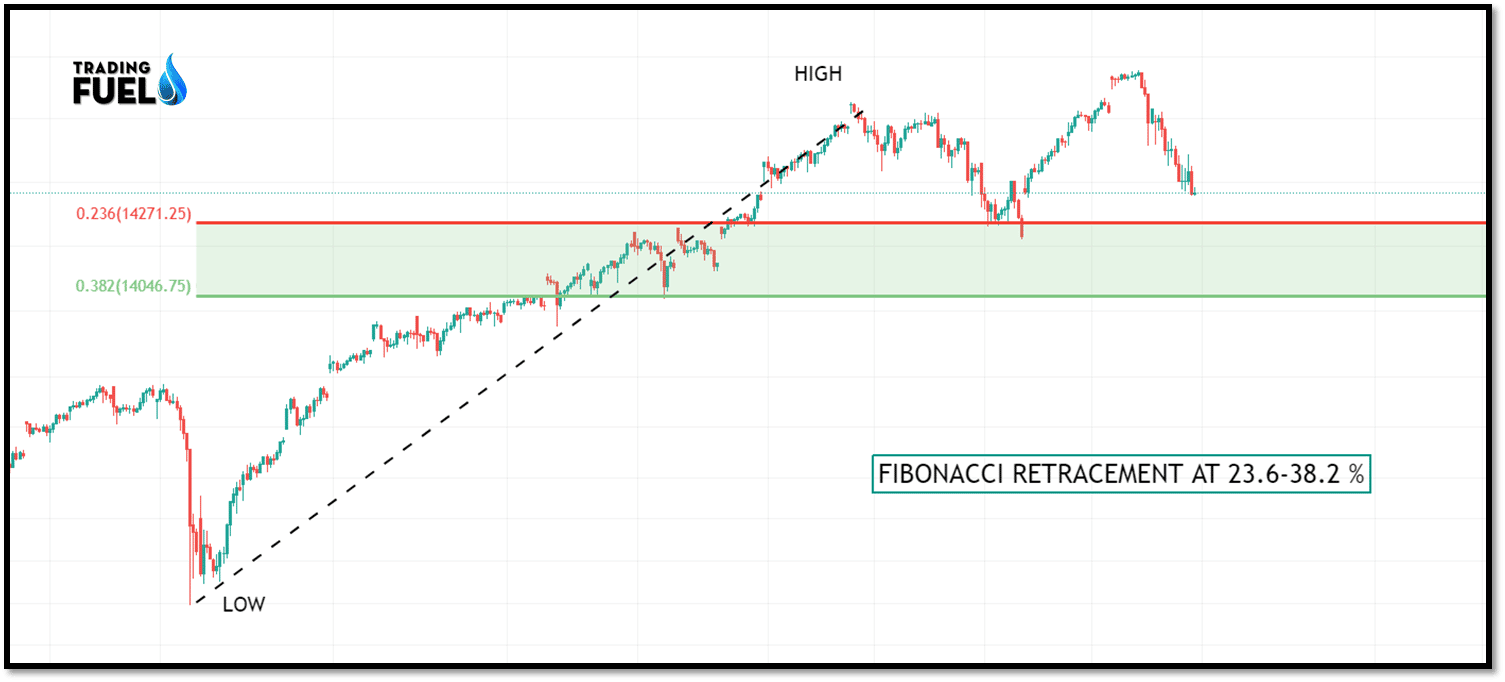
Fibonacci price retracements are marked form previous swing low to swing high using Fibonacci ratios such as 0.236, 0.382, 0.50, 0.618, and 0.786 to identify key support levels as the market is in pullback or counter-trend and will resume its original trend after arriving at some support level which might be a key Fibonacci level.
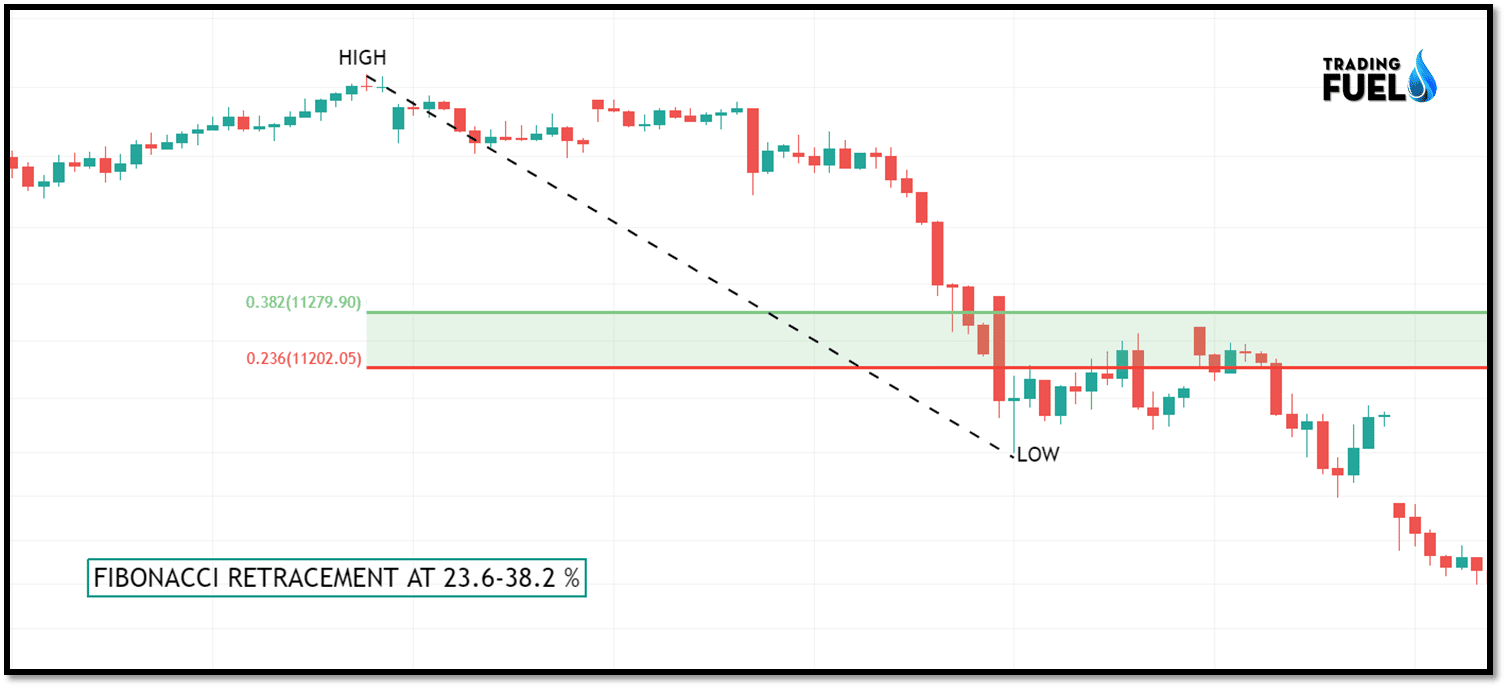
Retracements are also marked from the previous swing high to swing using Fibonacci tools to plot various Fibonacci ratios on the chart, these are the same ratios where the trader is looking for a possible resistance as the market rise from a swing low.
Fibonacci Price Extensions:
Fibonacci price extensions are similar to price retracements, in that they are also marked from prior lows to highs or from prior highs to lows.
The only difference is that with retracements, we are marking the previous swing high and low which are less than 100 percent retracement of the previous move, whereas, in extensions, we are marking the relationships of a previous swing high and low, which are extending beyond 100 percent of its previous move.
You are more than likely to be using the same Fibonacci tool from your analysis, these techniques are named different to indicate whether the price swing relation is occurring within the previous swing or extending beyond it.
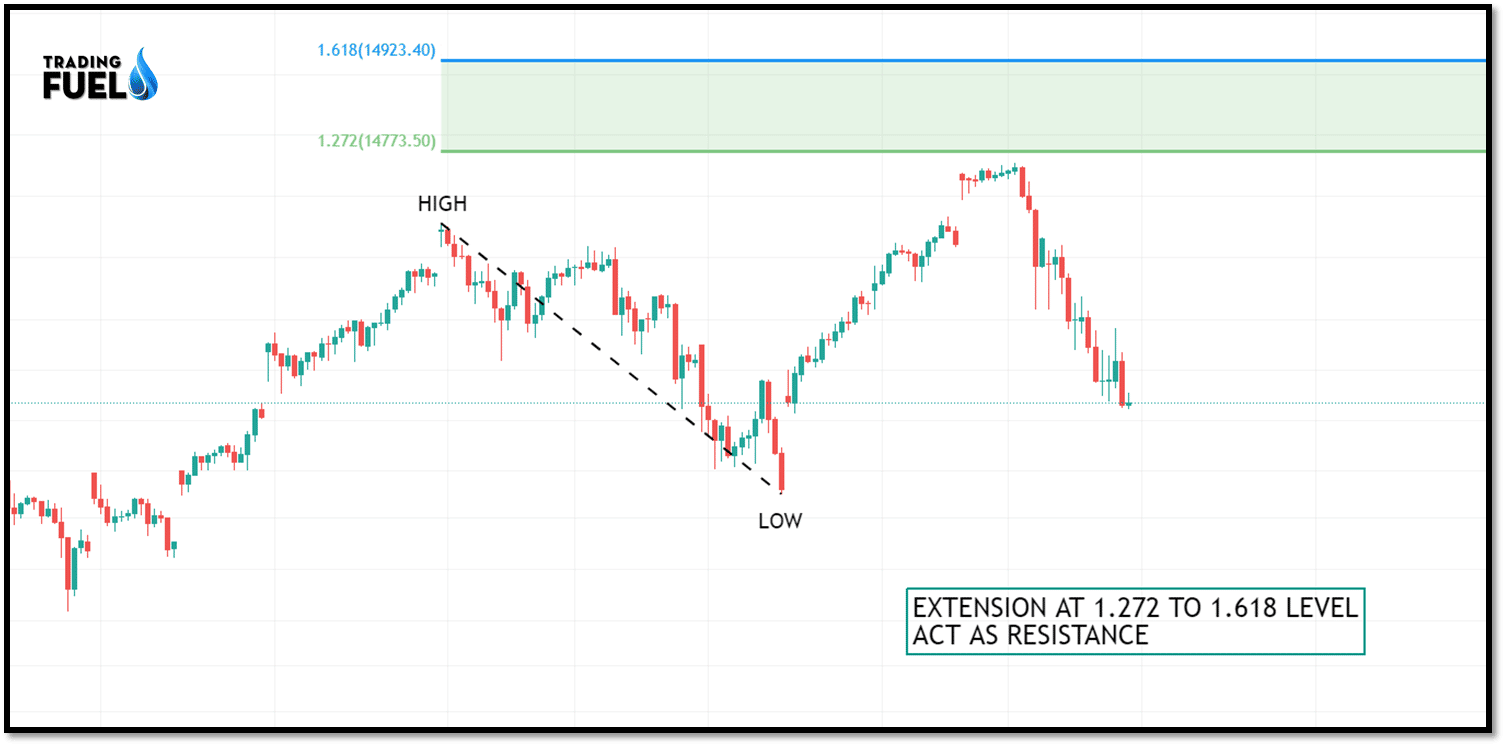
Extensions are marked from previous low-to-high swings using the Fibonacci ratios 1.272 and 1.618 for possible support levels.
Extensions are marked from previous high-to-low swings using the Fibonacci ratios 1.272 and 1.618 for possible resistance levels.
You can also add the ratios 2.618 and 4.236 for potential support and resistance levels.
Fibonacci Trading Strong Uptrend:

While judging the trend with Fibonacci levels, one measures each pullback in the price. In one see a series of higher high and lower low, with each high with a retracement of 50 percent or less, it can be said the stock is in a strong uptrend.
Fibonacci Trading Sideways Market:

If one sees retracements of 61.8 percent, 78.6 percent, or 100 percent, the stock is likely to remain in a sideways direction before the next move.
Fibonacci Trading Strong Downtrend:

While judging the trend with Fibonacci levels, one measures each pullback in the price. In one see a series of lower low and lower high, with each low with a retracement of 50 percent or less, it can be said the stock is in a strong downtrend.
Working on Fibonacci Trading and Retracement levels
Correction moves in the previous trend tend to end after falling into a certain price level. Which are often the Fibonacci Retracement levels.
Fibonacci retracement levels are widely used to identify potential areas of support and resistance. If a trader is willing to enter in to buy a contract, they watch for the price to respect at a Fibonacci level.
Fibonacci levels are nothing more than simple retracement levels. These levels are the only guide that a trader must keep in mind for potential support and resistance level.
Fibonacci Retracements are marked by drawing a trend line between swings high and low. Six horizontal lines are drawn at the Fibonacci levels of 0.0 %, 23.6 %, 38.2 %, 50 %, 61.8 %, and 100 %.
Fibonacci retracements levels are static levels they don’t change as moving average whereas moving average provides dynamic support and resistance levels.at such levels, traders expect some kind of price action to happen, either a breakout or a rejection of price.
The retracement concept is very popular, and widely used in many indicators like moving average, Elliot wave theory, MACD, and in conjunction with RSI also.
Depending on the trend of the market up, down, and sideways. Prices often retrace and find support at some percentage of the previous trend resuming the move in the original direction.
It is ideal to go long on a retracement at a Fibonacci support level when the market is an uptrend and to go short on a retracement at a Fibonacci resistance level when the market is a downtrend.
The 61.8 percent retracement can be marked as a golden retracement.
The 50 percent retracement is not based on a Fibonacci number. But this number also provides a support level based on Dow Theory that the Averages often retrace half their previous move.
Applying Fibonacci to the stock market pattern:

Fibonacci Ratios are also used in measuring the target of various types of Elliot waves within an Elliott Wave structure and uses to define the nature and characteristics of that particular wave.
Various waves of an Elliott Wave structure are correlated to one another with different Fibonacci Ratios. For example, in motive wave:
• Wave 2 is near about 50%, 61.8%, 76.4%, or 85.4% of previous wave 1
• Wave 3 is near about 161.8% of wave 1
• Wave 4 is near about 14.6%, 23.6%, or 38.2% of previous wave 3
• Wave 5 is near about inverse 1.236 – 1.618% of wave 4.
Traders can make use of the Fibonacci level to differentiate various waves and make a correct analysis. To determine the right point of entry and exit levels before entering a trade.
Conclusion:
In this blog, we have discussed the history and basis of Fibonacci’s and its implication in the share market, and how we can use Fibonacci to identify uptrend, downtrend, and sideways. Also how to plot key resistance and support in downtrend and uptrend both. Other than the technical aspect, Fibonacci must be used with another system to confirm the entry and exit levels. Standalone Fibonacci must not be used.
Contain & Image ©️ Copyright By, Trading Fuel Research Lab