How to Use Head and Shoulders Pattern? | (Chart Pattern Part 1):
Introduction to Chart Pattern:
In technical analysis rising and falling in price is often signaled by price pattern. The technical analysis used price patterns to examine the current movement and forecast future market movement. Chart patterns are one of the most useful tools that provide a high probability trade setup. In this article, we will discuss the basic chart pattern and formation. Chart formation will help you to spot conditions where the market is ready to breakout. They can also indicate whether the price will continue in its current direction or not.
Continuous and Reversal Patterns:
For simplicity, a chart pattern can be divided into reversal pattern and continuation pattern, and both are exactly what they sound like
- Reversal patterns are those chart formation that signal the current trend is about to change course.
- Continuation patterns are those chart formation that signal the current trend will resume.
Reversal Patterns:
- Head and shoulders Pattern.
- Inverted head and shoulders Pattern.
- Double top.
- Double bottom.
- Triple top.
- Triple bottom.
Continuation Patterns:
- Triangle.
- Flat and pennant.
- Cup with handle.
In this blog, We will talk about Head and Shoulders Pattern (H&S Pattern). The rest of the chart pattern will cover in the next part. So, let’s Understand Part 1.
1. Head and Shoulders Pattern:
What does a head and shoulders pattern look like?
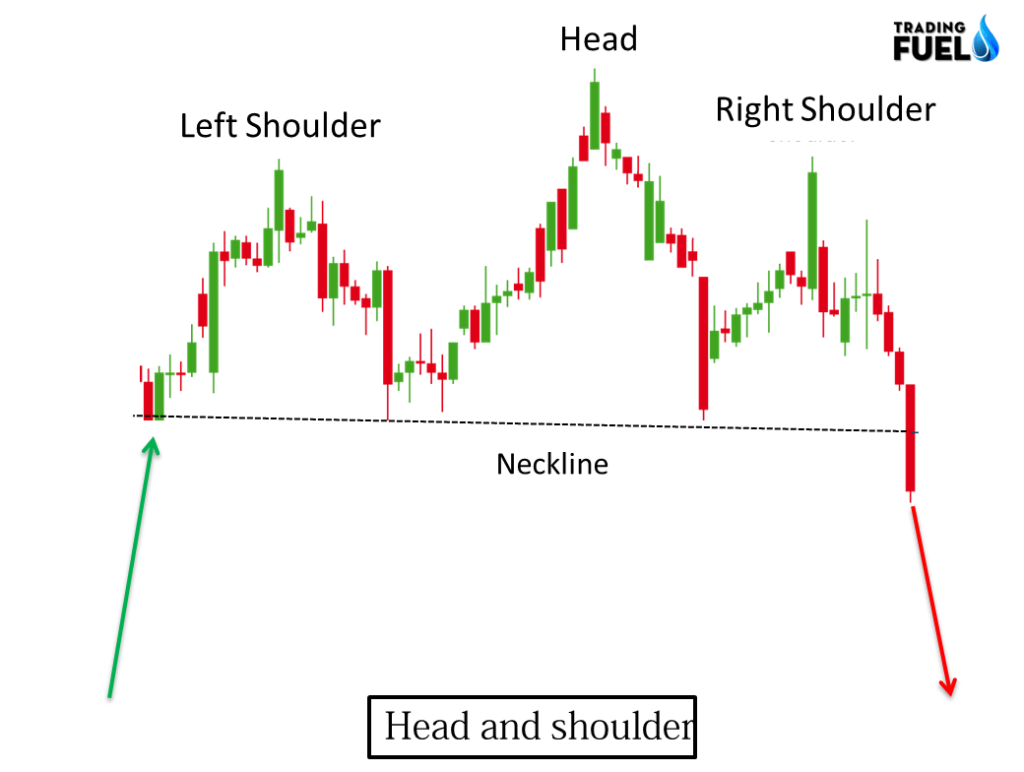
Head and shoulder pattern is a bearish reversal pattern formation.
Head and shoulder is a chart pattern in which a larger peak has a slightly smaller peak on either side of it.
A neckline is drawn by connecting the lowest point of two swing lows.
Once the third peak has fallen back to the level of support it is likely to break out into a bearish downtrend.
Key component:
- Prior trend:
It is important to understand the trend direction to trade reversal because without a prior uptrend there cannot be head and shoulder reversal patterns. If a head and shoulder pattern form without a prior uptrend it is most likely to fail. Head and shoulder forming after a strong uptrend are valid reversal patterns to trade.
- Left shoulder:
In an up-trending market the left shoulder form at the high of current market direction. After forming this peak the price decline to form a swing low, and left shoulder completed at this point and it is 1st for neckline formation .this low remain above the prior uptrend line, keeping the uptrend intact.
- Head:
After the formation of the left shoulder, the price exceeds prior to high and form higher high formation and it is marked as top of the trend. After peak formed the price decline near the level of the prior swing low, and it forms the second point for the neckline. This low usually breaks the uptrend line and indicates a loss in market momentum.
- Right shoulder:
After the formation of the top, the market declined to form 2nd point for the neckline. From there Market rises to form a lower peak (lower high) and it is usually in line with the left shoulder .while symmetry is preferred but sometimes the shoulder can be asymmetry in terms of price movement. The decline forms the right shoulder break the neckline.
- Neckline:
The neckline form by connecting the low of the left and right shoulder (point 1 and point 2), point 1 is marked as the end of the left shoulder and beginning of the head. Low 2 is marked as the end of the head and beginning of the right shoulder. The slope of the neckline indicates the strength of the bear. A down word slope is more bearish than the upward slope.
How to trade Head and shoulders pattern?
Entry: Connect head and shoulder bottom in a trend line or neckline. When the price closed below the neckline, a potential short trade is triggered. Short after one candle close below the low of the breakdown candle.
Target: Compute the vertical distance between the top of the head and shoulder patterns and the neckline the same distance is taken as target form the neckline.
Stop: After a trader entry if the price closes above the neckline, a potential failure of the pattern is signaled. Place stop order above the neckline.
Volume confirmation in Head and shoulder:
- High volume on the first peak.
- Moderate volume on the middle peak.
- Low volume on the third peak.
- A sharp increase in the volume on the breakdown candle.
Example of head and shoulder:

Entry: After a candle closes below the neckline with heavy volume, short entry can be done below that candle low.
Exit: Minimum target can be place at a distance equal to the distance of head to neckline.
Stop loss: Stop loss must be place above the high of the right shoulder.
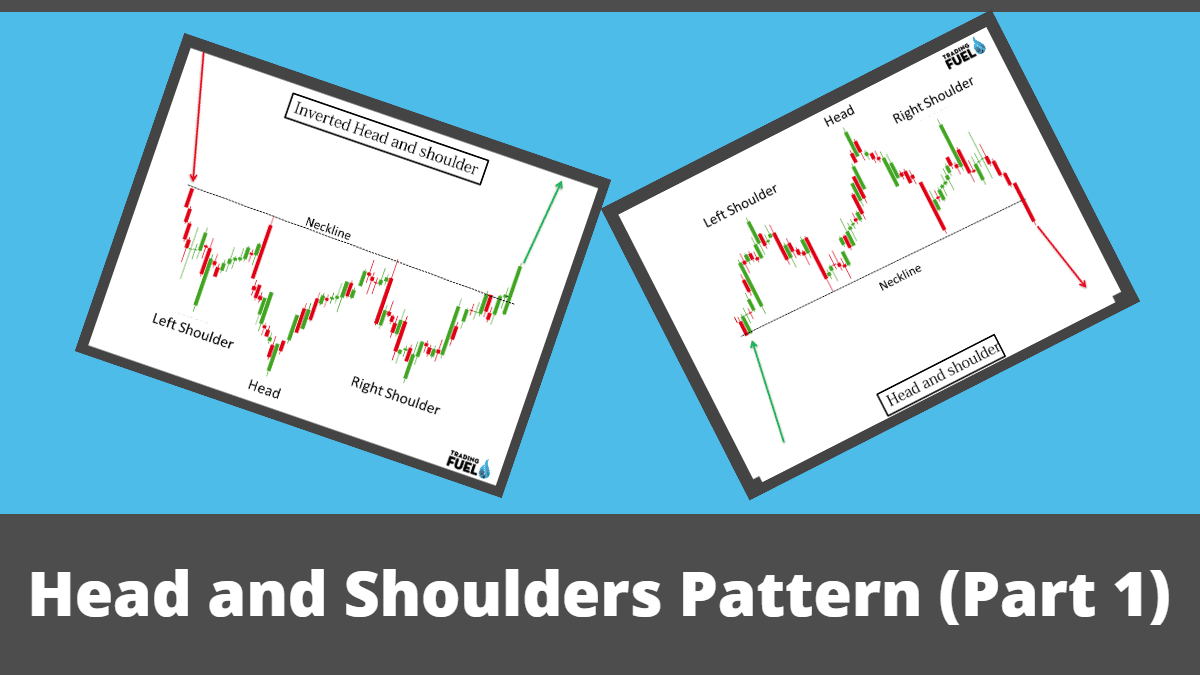
2. Inverse Head and Shoulder Pattern:
The name speaks for itself it is head and shoulder formation except this time it is upside down with this formation we would place a long entry order above neckline.

What does an Inverse head and shoulder look like?
An inverse head and shoulder pattern is a bullish reversal pattern formation.
Inverse Head and shoulder is a chart pattern in which a larger trough has a slightly smaller trough on either side of it.
A neckline is drawn by connecting the highest point of two swings high.
Once the third peak has risen to the level of resistance it is likely to break out into a bullish uptrend.
Key component:
- Prior trend:
It is important to understand the trend direction to trade reversal, because without a prior downtrend there cannot be an Inverse head and shoulder reversal patterns. If an inverse head and shoulder pattern form without a prior downtrend it is most likely to fail. Inverse Head and shoulder forming after a strong downtrend are valid reversal patterns to trade.
- Left shoulder:
In a down-trending market the left shoulder form at the low of current market direction. After forming this trough the price rises to form lower high, and left shoulder completed at this point and it is 1st for neckline formation .this high remain below the prior down trend line, keeping downtrend intact.
- Head:
After the formation of the left shoulder, price decline below prior low and form lower low formation and it is marked as the bottom of the trend. After trough formed the price advance near the level of prior swing high, and it forms the second point for the neckline. This high usually breaks the downtrend line and indicates a loss in market momentum.
- Right shoulder:
After the formation of the bottom, the market rises to form 2nd point for the neckline. From there Market decline to form a higher trough (higher low) and it is usually in line with the left shoulder .while symmetry is preferred but sometimes shoulder can be asymmetry in terms of price movement. The rise form the right shoulder breaks the neckline.
- Neckline:
The neckline form by connecting the low of the left and right shoulder (point 1 and point 2), point 1 is marked as the end of the left shoulder and beginning of the head. Low 2 is marked as the end of the head and beginning of the right shoulder. The slope of the neckline indicates the strength of the bulls. The upward slope is more bullish than the downward slope.
How to trade Inverse Head and shoulders pattern?
Entry: Connect Inverse head and shoulder top in a trend line or neckline. When the price closed above the neckline, a potential long trade is triggered. Long after one candle closes above the high of the break out a candle.
Target: Compute the vertical distance between the bottom of the Inverse Head and shoulder patterns and the neckline the same distance is taken as target form the neckline.
Stop: After a trader entry if the price closes below the neckline, a potential failure of the pattern is signaled. Place the stop order below the neckline.
Volume confirmation in Inverse Head and shoulder:
- High volume on the first peak
- Moderate volume on the middle peak
- Low volume on the third peak
- A sharp increase in the volume on the break out candle.
Example of inverse head and shoulder:

Entry: After a candle closes above the neckline with heavy volume, long entry can be done above that candle high.
Exit: Minimum target can be place at a distance equal to the distance of head form neckline
Stop loss: Stop loss must be place below the low of the right shoulder.
Conclusion:
In this article, we have covered the basics of a price pattern and discussed two important reversal patterns, head, and shoulder & inverted head and shoulder. Their construction, component, and method to trade them. As these patterns are clear and easy to identify, it provides a complete trading system to the novice traders. As all the necessary conditions like stop-loss, entry, the Exit point is predefined here and there is little or no room for trader’s own judgment. For beginners, it is the simplest way to start price action trading. Focusing on signal setup is more profitable in the long term.
Contain & Image ©️ Copyright By, Trading Fuel Research Lab