
How to use the India VIX to predict market sentiments?: India VIX stands for “volatility index.”
Hence, in the stock market, VIX indicates the volatility of the stock indices.
We are all aware that the market is volatile and, hence, investors will wish to predict the way the market will perform in the coming days.
Why India VIX?
The VIX was designed to indicate the perception of investors regarding the annual market volatility over the next 30 days.

- Vice versa, it is the case when there is a lower VIX.
- Hence, with the help of VIX, one can definitely predict the way the market will perform in the coming time period.
- Now, we know why we need VIX, but let us also learn what exactly VIX is.
What is India VIX?
- The volatility index, or VIX, is described as the rate and magnitude of the changes in prices and also the changes with the change in price.
- The other name of the VIX is the Fear Gauge or Fear Index.
- When someone says “VIX” for the US market, it will show the volatility of the S&P 500 index.
- In India, the VIX that is based on the NIFTY Index Option prices is called the India VIX.
- A VIX is a measure of the amount by which an index is expected to move based on the order book of the particular underlying index options.
- The VIX is basically calculated as an annualized volatility that is denoted by a number and used as a percentage, for example, 30%.
- Let us understand this with the help of an example. If today’s India VIX is 30%, this will mean that we can expect an annual change of 30% in NIFTY in the next 30 days.
- This will imply that the NIFTY is supposed to be between +30% and -30% from today’s price of NIFTY for the next 1 year and for the next 30 days.
- So, if the NIFTY is at 10,000 points today, then the expected range of the same has to be between 7000 and 13,000 for 1 year.
Also Read: What is Index Trading?
History of India VIX:
- The VIX is the first benchmark index that was introduced by the CBOE (Chicago Board of Options Exchange) in 1993 so as to measure the market’s expectation of future volatility.
- NSE started India VIX in 2008.
- The India VIX is using the computation methodology of CBOE with modifications to adapt to the NIFTY options order book.
- India VIX is an index, and in order to trade on it, you must first purchase a derivative (F&O) contract.
- Hence, the India VIX futures are available, which will be used by sophisticated traders to use India VIX to hedge the volatility risk or speculate on it.
- The historical data for the India VIX is available from March 2, 2009, but the futures trading started on February 26, 2014.
The technical definition of VIX:
- The VIX is derived from the index option prices by using the best bid and ask quotes of the out-of-the-money near and mid-month NIFTY option contracts that are traded on the derivatives segment of the NSE.
- The calculation of the India VIX is based on the Black Scholes Model, which is used to price the options contract.
The Black Scholes model uses the 5 key variables to arrive at the fair price of the option contract, such as:
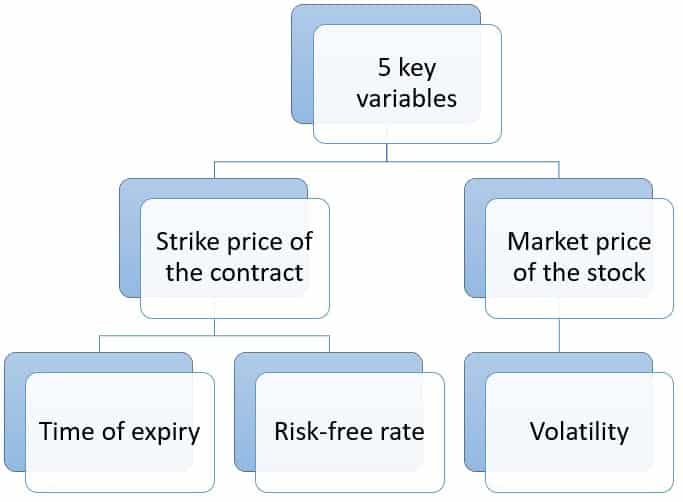
The formula that is used to calculate the India VIX is explained on the NSE website:
India VIX and NIFTY correlation:
- The Indian VIX will represent the fear or the risk factor in the stock market.
- Hence, an increase in the Indian VIX will mean that the risk has increased and, therefore, the market should fall.
- Basically, there is an inverse correlation between the Indian VIX and the NIFTY.
- Rationally, if the market is expected to fall, many option traders are expected to buy the put options.
- When the premium for these put options increases, the VIX will also increase.
- There were also times when the NIFTY and VIX both rose together.
- This correlation turned out to be the most positive one for the market.
- The VIX always reflects fear, and the market will always co-vary negatively with that fear.
- Hence, VIX is a very good measure of the risk perception of the markets.
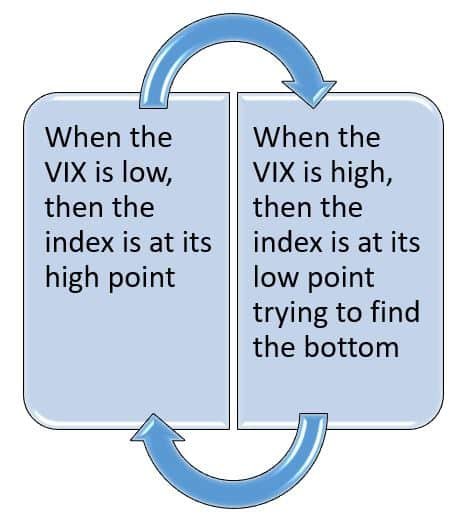
- If the Indian VIX is decreasing, it will mean that the market should go up due to the low risk factor and fear.
- If the Indian VIX is high, it will mean that the market will fall, and then the market will rise.
The main points that the India VIX will indicate to the market:
- The VIX index measures the volatility or risk in the market.
- But the main question is how to apply the same practically.
Here are the 6 main ways through which you can do the same:

For equity traders, the VIX is a very good and sound measure of the risk in the market:
- This will provide intraday and short-term traders with an indication of whether market volatility is increasing or decreasing.
- Through this, they can easily calibrate their strategy.
- For example, if volatility is likely to shoot up sharply, intraday traders will run the risk of the stop loss getting triggered.
- Hence, they can also either reduce their leverage or widen their stop loss accordingly.
VIX is a very good indicator for long-term investors:
- Short-term volatility does not bother long-term investors.
- But, if we look at institutional investors and proprietary desks, then they will have limitations in terms of risk and MTM losses.
- When the VIX is rising, this will indicate that they can increase their hedges in the form of puts to play the market both ways.
VIX is a very useful indicator for options traders:
- The main decision to buy or sell an option is based on volatility.
- When volatility rises, options are likely to become more valuable and the buyers tend to gain more.
- When the VIX comes down, there will be more wasting of time and the option sellers are likely to benefit more.
VIX is also useful for trading volatility:
- If you expect the market to become more volatile, one strategy is to buy straddles or strangles.
- These will become too expensive when volatility is likely to rise.
- The best way is to buy futures on the VIX itself so that we can benefit from the volatility without worrying about the direction of the market movement.
VIX is a very useful as well as a reliable gauge of the index movement:
- If you are plotting the VIX and the movement of NIFTY for the last 9 years since the inception of the VIX, you will see a very clear negative correlation in the charts themselves.
- Markets will peak out when the VIX bottoms out.
- This is useful for index traders.
VIX is an invaluable tool for portfolio managers as well as mutual fund managers:
- Both the managers can look to increase their exposure to a high beta portfolio when the VIX has peaked out, and then they can add on to a low beta portfolio when the VIX bottoms out.
Conclusion:
We hope that the above blog has given you clarity about the Indian VIX as well as the market sentiments.
Frequently Asked Questions (FAQs)
About Us:
Trading Fuel is our website for blogs where we give you knowledge about finance, the stock market, and intraday trading.
~Stay tuned with us for more blogs~