
What Is the Ichimoku Indicator?
In Japanese the meaning of Ichimoku kinko hyo is “one glance equilibrium chart”, it was developed by Goichi Hosoda in late 1930, a Japanese journalist name Ichimoku Sanjin spent his 30 year in perfection the technique of Goichi Hosoda and in the year 1960 he finally published his work, describing the detail of this indicator and different component that we will see later, in Ichimoku indicator is a unique indicator because it provides the information to trader such as,
- The direction of the trend (up, down, sideways),
- Strength of the momentum
- Current support and resistance
- Future support and resistance
It is called one Glance because all this different information is available to traders in a single indicator and traders needed only one glance to analysis any tradable security, and that’s why it is named Ichimoku, the “one glance” indicator.
Component of Ichimoku Cloud

- Tenkan sen or conversion line: it is used as a signal line denoted by red colour, it acts as a minor support and resistance, price bounce after a minor pullback form tenkan sen, it is the average of the highest high + lowest low or past 9 periods.
- Kijun sen or baseline: it is used as confirmation line support and resistance, also used as a trailing sl in the daily time frame, it is indicated by the blue line, if the price is sustaining above kijun sen it would be considered as a bullish sign, as we can assume that price will climb higher
- Chikou span: today’s closing price was plotted 26 days back, it is indicated as a buy signal and the green line, it is also called the lagging span used as a support and resistance, also depending on its position in the chart strength of the momentum can be known. If the chikou span (the green line) crosses the price in the bottom-up direction, that is a buy signal. If the green line crosses the price from the top down, that is a sell signal.
- Kumo cloud: it is the space between the senkou span a span b, the cloud edge represents the current and future support resistance, and its thickness gives the idea regarding the state of the market i.e, either trending(narrow cloud) or sideway(thick cloud) price above the cloud is considered to be bullish, and price below the cloud is bearish, price within the cloud is considered to be in a consolidation phase
- Senkou span and senkou span b: span a and span b are the outer boundary of the cloud for a bullish market span a is above the span b, and vice versa, the cloud is of green colour for a bullish market and of red colour for a bearish market, span a and span b cross over reflect the key trend reversal or trend continuation point in the chart
You also like: Best Technical Analysis Books
The calculation for Ichimoku cloud
The following are the five formulas for different components of the Ichimoku cloud.
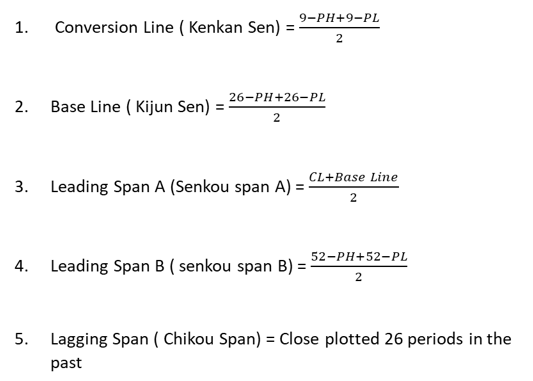
Ph = period high
Pl = period low
Cl = conversion line
What does the Ichimoku cloud tell you?
Ichimoku cloud is a complete system in itself, that tells the direction and movement of the market, along with the support and resistance (current and future), it gives signals like
- T-sen & k-sen crossover,
- K-sen & price crossover,
- Price & cloud breakout,
- Future cloud cross-over,
along with them, we look at the position of the chikuspan concerning price and the position of price with respect to with cloud, and then confirm the signal to avoid any false trade
In general price above the cloud, it is said to be bullish and the price below the cloud is said to be bearish, and when the price is within the cloud it is in the sideways moment, better not to take any trade within the cloud as there is no clear trend in the market, for high probability it is always better to trade in the direction of the bigger trend so it is advisable to buy only above the cloud and sell when is the price is below the cloud.
Example:1 let’s look at t-sen & k-sen crossover trading strategy
Crossover is another way the indicator can be used. Watch for the t-sen line (blue line) to move below the k-sen(red) line, especially when the price is below the cloud. This can be a powerful sell signal.

This chart 5 points are clear to us which gives us an idea about the possible trade setup
- Trend– price is below the cloud, signalling a downtrend.
- Momentum– we get the information about the momentum from chiku span, when the crossover of the blue and red line occur, at that point, the chikuspan (green line) was at the location represented by point 3, where the green line was below the price which tells us that momentum is downward.
- Confirmation – point 4 represents the cross of the cloud, which signal the start of a new trend.
- Confirmation – point 5 shows that the price is below the cloud, indicating a weakness, also the future cloud is red and below the price, in that case, the cloud will act as a resistance to price.
- Entry point – at point 2, it is the place where the crossover of the blue (tenkan sen) and red (kijun sen) occur indicating the change in trend from sideways to downward, we will enter a long trade at that point
- Stop-loss here stop loss could be placed outside the upper cloud border.
- Exit – One could exit at a point when he is getting a good risk-to-reward ratio or when the trend changed form down to up i.e. when the price crosses the k–sen form downside to the upside which happens at 14:00, after a green candle close above the k–sen line.
Learn More About: TECHNICAL ANALYSIS
Example:2 let’s look at price and breakout trading strategy:
Here in this strategy then the price cross above the cloud after a downtrend, and closed above it, we will look for a buy setup
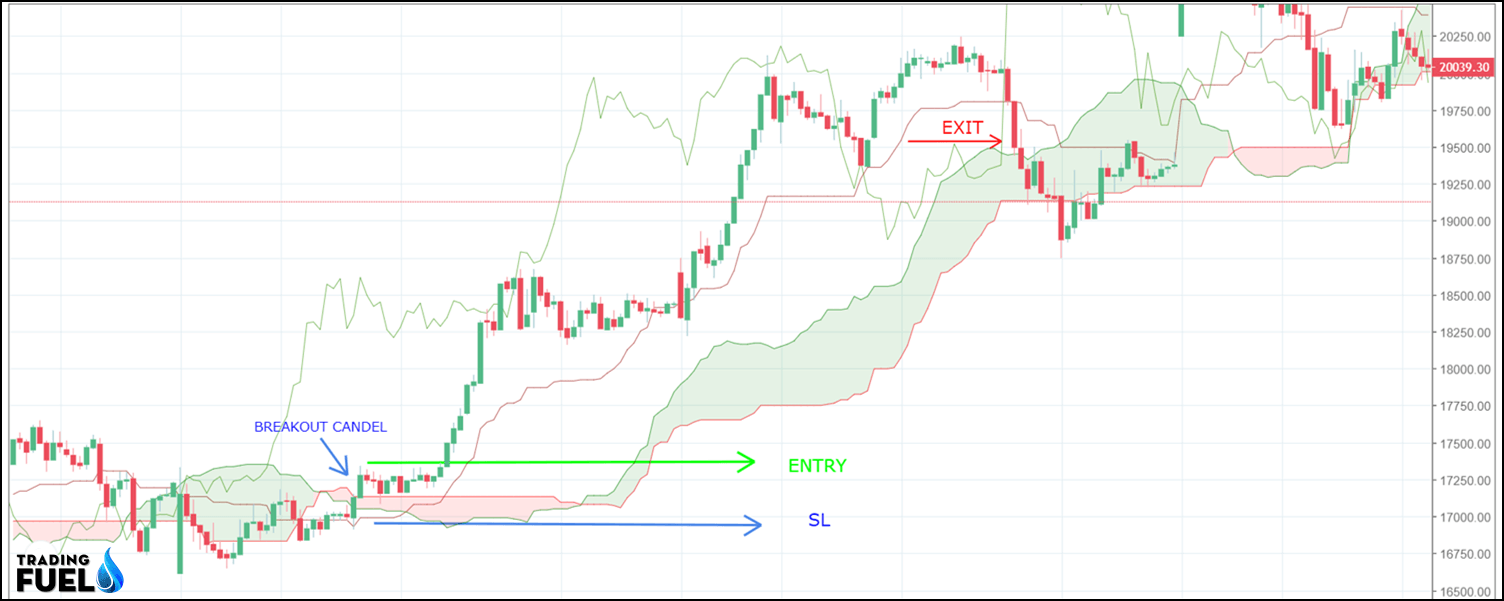
The underlying asset is bank nifty future
Here is how to read the Ichimoku chart
- Trend up, as the price crossed the cloud and closed above it,
- Momentum? We get the information about the momentum from chiku span, when the price closed above the cloud, at that point, the chikuspan (green line) was in open space, and the green line was below the price which tells us that momentum is upward.
- Confirmation before the breakout there was the cloud crossover, which signal the start of a new trend.
- The confirmation price is above the cloud, indicating a strength, also the future cloud is green and above the price, in that case, the cloud will act as a support to the price.
- Entry point – When the high of the candle which closed above the cloud is a broker we will enter a long trade at that point
- Stoploss– here sl could be placed outside the lower cloud border.
- Exit – one could exit at a point when he is getting a good risk-to-reward ratio or when the trend changed form up to down i.e. when the price crosses the k –sen form upside to the downside after a red candle close below the k sen line.
Traders should use the Ichimoku cloud in conjunction with other technical indicators to avoid false trade,
Ichimoku cloud vs moving averages
One indicator is not better than another, they just provide information in different ways.
Ichimoku is also a collection of information form past averages, but as the Ichimoku is calculated based on the high and low, rather than a close price, it accounts for and reflects the volatility of the underlying asset in a much better way, which helps us in placing the stop loss or trailing sl.
Limitations of using the Ichimoku cloud
Since there are a lot of elements in the cloud which reflect different information at the same time this can make the chart messy, and difficult to understand if the concept of the Ichimoku is not clear to the trader.
Download the Ichimoku chart For Amibroker (AFL)
// Downloaded From https://www.TradingFuel.com
_SECTION_BEGIN("i");
/* ICHIMOKU CHART */
n1 = Param("Èøèìîêó: ïåðèîä 1",9,1,200,1);
n2 = Param("Èøèìîêó: ïåðèîä 2",26,1,400,1);
n3 = Param("Èøèìîêó: ïåðèîä 3",52,1,600,1);

TenkanSen   =(HHV(H,n1)+LLV(L,n1))/2;            // Tenkan-sen (Òåíêàí-ñåí) – ýòî ñðåäíåå çíà÷åíèå öåíû çà ïåðâûé ïðîìåæóòîê âðåìåíè (ðàâíà (high+low)/2, ãäå high è low – ìàêñèìóì è ìèíèìóì çà ïåðèîä).
KijunSen    =(HHV(H,n2)+LLV(L,n2))/2;            // Kijun-sen (Êèäæóí-ñåí) – ýòî ñðåäíåå çíà÷åíèå öåíû çà âòîðîé ïðîìåæóòîê.
ChinkouSpan =Ref(C,-n2);                          // Chinkou Span (×èêîó ñïåí) - öåíà çàêðûòèÿ òåêóùåãî áàðà, ñäâèíóòàÿ íàçàä íà âåëè÷èíó âòîðîãî âðåìåííîãî èíòåðâàëà.
Cks         = Close;                             // Ãðàôè÷åñêèé Chinkou Span, ñäâèã íàçàä çàñ÷åò îòðèñîâêè.
SenkouSpanA =Ref((KijunSen+TenkanSen)/2,-n2);    // Senkou Span A (Ñåíêîó ñïåí À) / Up Kumo - ñåðåäèíà ðàññòîÿíèÿ ìåæäó Tenkan-sen è Kijun-sen, ñäâèíóòîå âïåðåä íà âåëè÷èíó âòîðîãî âðåìåííîãî èíòåðâàëà.
SpA         =(KijunSen+TenkanSen)/2;             // Ãðàôè÷åñêèé Senkou Span A , ñäâèã âïåðåä çàñ÷åò îòðèñîâêè.
SenkouSpanB =Ref((HHV(H,n3)+LLV(L,n3))/2,-n2);   // Senkou Span B (Ñåíêîó ñïåí Â) / Down Kumo - ñðåäíåå çíà÷åíèå öåíû çà òðåòèé âðåìåííîé èíòåðâàë, ñäâèíóòîå âïåðåä íà âåëè÷èíó âòîðîãî âðåìåííîãî èíòåðâàëà.
SpB         =(HHV(H,n3)+LLV(L,n3))/2;            // Ãðàôè÷åñêèé Senkou Span B, ñäâèã âïåðåä çàñ÷åò îòðèñîâêè.
DL = Ref( C, 25 );


Cond1 =  Ref(Close > Max(SenkouSpanA,SenkouSpanB),-1);  //öåíà âûøå îáëàêà  -- áû÷üå íàñòðîåíèå
Cond2 =  Ref(Close < Min(SenkouSpanA,SenkouSpanB),-1);  //öåíà íèæå îáëàêà  -- ìåäâåæüå íàñòðîåíèå
Cond3 =  Ref(Cross(TenkanSen,KijunSen),-1);  //ïåðåñå÷åíèå Òåíêàí è Êèäæóí -- ñèãíàë íà ïîêóïêó
Cond4 =  Ref(Cross(KijunSen,TenkanSen),-1);  //ïåðåñå÷åíèå Òåíêàí è Êèäæóí -- ñèãíàë íà ïðîäàæó
Cond5 =  Ref(Cross(Close,ChinkouSpan ),-1);  //ïåðåñå÷åíèå ×èêîó è öåíû
Cond6 =  Ref(Cross(ChinkouSpan ,Close),-1);  //ïåðåñå÷åíèå ×èêîó è öåíû
Cond7 =  Ref(Cross (Close , Max(SenkouSpanA,SenkouSpanB)),-1);  //öåíà âûõîäèò ââåðõ èç îáëàêà  -- ñèãíàë íà ïîêóïêó
Cond8 =  Ref(Cross ( Min(SenkouSpanA,SenkouSpanB), Close),-1);  //öåíà âûõîäèò âíèç  èç îáëàêà  -- ñèãíàë íà ïðîäàæó
Cond9 = Close > TenkanSen AND TenkanSen > KijunSen AND KijunSen > Max(SenkouSpanA,SenkouSpanB); // ñèãíàë òðåõ ëèíèé ââåðõ
Cond10= Close < TenkanSen AND TenkanSen < KijunSen AND KijunSen < Min(SenkouSpanA,SenkouSpanB); // ñèãíàë òðåõ ëèíèé âíèç
RemCond9=ExRem(Cond9,NOT Cond9);
RemCond10=ExRem(Cond10,NOT Cond10);

ColSenk =IIf (Cond1,colorGreen, IIf(Cond2,colorRed,colorLightGrey)); // çàäàåò öâåò, åñëè öåíà âûøå/íèæå/âíóòðè îáëàêà.
Flat  =  TenkanSen == Ref(TenkanSen,-1) OR (NOT(Cond1) AND NOT(Cond2)) ;

for( i = 0; i < BarCount; i++ ) //ðàñêðàøèâàåò ñðåäíþþ ëèíèþ èíäèêàòîðà ïî âçàèìîðàñïîëîæåíèþ è íàïðàâëåíèÿ äâèæåíèÿ TenkanSen, öåíû è îáëàêà.
{
   if (Flat[i])
      ColTenk[i] = colorLightGrey;
   else
   {
if (Cond1[i] AND TenkanSen[i] > TenkanSen[i-1])
     ColTenk[i] = colorGreen;
if (Cond1[i] AND TenkanSen[i] < TenkanSen[i-1])
     ColTenk[i] = colorRed;
if (Cond2[i] AND TenkanSen[i] < TenkanSen[i-1])
     ColTenk[i] = colorRed;
if (Cond2[i] AND TenkanSen[i] > TenkanSen[i-1])
     ColTenk[i] = colorGreen;
   }
}


AlertIf( Cond3 OR Cond4, "SOUND c:/WINDOWS/Media/notify.wav", "ïåðåñå÷åíèå Òåíêàí è Êèäæóí",0,1+2+4+8);
AlertIf( Cond5 OR Cond6, "SOUND c:/WINDOWS/Media/notify.wav", "ïåðåñå÷åíèå ×èêîó è öåíû",0,1+2+4+8);
AlertIf( Cond7 OR Cond8, "SOUND c:/WINDOWS/Media/notify.wav", "öåíà âûõîäèò  èç îáëàêà",0,1+2+4+8);
AlertIf( RemCond9 OR RemCond10, "SOUND c:/WINDOWS/Media/notify.wav", "ñèãíàë òðåõ ëèíèé",0,1+2+4+8);

//PlotShapes(IIf(Cond7, shapeSmallUpTriangle ,shapeNone),colorGreen,0,H,10);
//PlotShapes(IIf(Cond8, shapeSmallDownTriangle ,shapeNone),colorRed,0,L,10);
//PlotShapes(IIf(Cond3, shapeHollowSmallUpTriangle,shapeNone),colorGreen,0,H,12);
//PlotShapes(IIf(Cond4, shapeHollowSmallDownTriangle ,shapeNone),colorRed,0,L,12);
//PlotShapes(IIf(Cond5, shapeSmallCircle ,shapeNone),colorGreen,0,H,4);
//PlotShapes(IIf(Cond6, shapeSmallCircle + shapePositionAbove ,shapeNone),colorRed,0,L,4);
//PlotShapes(IIf(RemCond9 , shapeHollowSquare ,shapeNone),colorGreen,0,H,18);
//PlotShapes(IIf(RemCond10, shapeHollowSquare + shapePositionAbove ,shapeNone),colorRed,0,L,18);

//Plot (C,"Close",colorBlack,styleThick);
Plot (C,"Bars",colorBlack,styleCandle);
Plot (TenkanSen,"Tenkan-sen",colorRed);
Plot (KijunSen, "Kijun-sen", colorBlue);
Plot (Cks,"Chinkou Span",colorLime, style = styleLine,0,0,-n2);
Plot (SpA,"SenkouSpanA",colorOrange,styleDashed,0,0,n2);
Plot (SpB,"SenkouSpanB",colorViolet,styleDashed + styleThick,0,0,n2);
PlotOHLC (SpA,SpA,SpB,SpB,"Cloud",IIf (SpA > SpB,colorPink,colorLavender),styleCloud, 10, 10, n2 );
above = IIf(KijunSen>SenkouSpanA AND TenkanSen>SenkouSpanB,1,0);
within = IIf(KijunSen>SenkouSpanA AND TenkanSen<SenkouSpanB,1,0);
below = IIf(TenkanSen<SenkouSpanA AND TenkanSen<SenkouSpanB,1,0);
Buy = Cross(TenkanSen,KijunSen) AND (DL>Close);
Sell = Cross(KijunSen,TenkanSen) AND (DL<KijunSen);
StrongBuy = Buy AND above;
MediumBuy = Buy AND within;
WeakBuy = Buy AND below;
StrongSell = Sell AND below;
MediumSell = Sell AND within;
WeakSell = Sell AND above;

IIf( (StrongBuy),PlotShapes(shapeUpTriangle*StrongBuy,colorGreen),0);
IIf( (MediumBuy),PlotShapes(shapeUpArrow*MediumBuy,colorGreen),0);
IIf( (WeakBuy),PlotShapes(shapeHollowUpArrow*WeakBuy,colorIndigo),0);
IIf( (StrongSell),PlotShapes(shapeDownTriangle*StrongSell,colorRed),0);
IIf( (MediumSell),PlotShapes(shapeDownArrow*MediumSell,colorRed),0);
IIf( (WeakSell),PlotShapes(shapeHollowDownArrow*WeakSell,colorBrown),0);


// Ãîðèçîíòàëüíàÿ öâåòíàÿ èíäèêàòîðíàÿ ïîëîñà (ïðèìåð).


Plot( 1, "Ribbon", ColTenk, styleOwnScale|styleArea|styleNoLabel, -2, 200 );   // èíäèöèðóåò ôëýò íà TenkanSen.
Plot( 4, "Ribbon", ColSenk, styleOwnScale|styleArea|styleNoLabel, -1, 200 );   // èíäèöèðóåò ïîëîæåíèå öåíû îòíîñèòåëüíî îáëàêà
_SECTION_END();
Contain & Image ©️ Copyright By, Trading Fuel || Research Lab