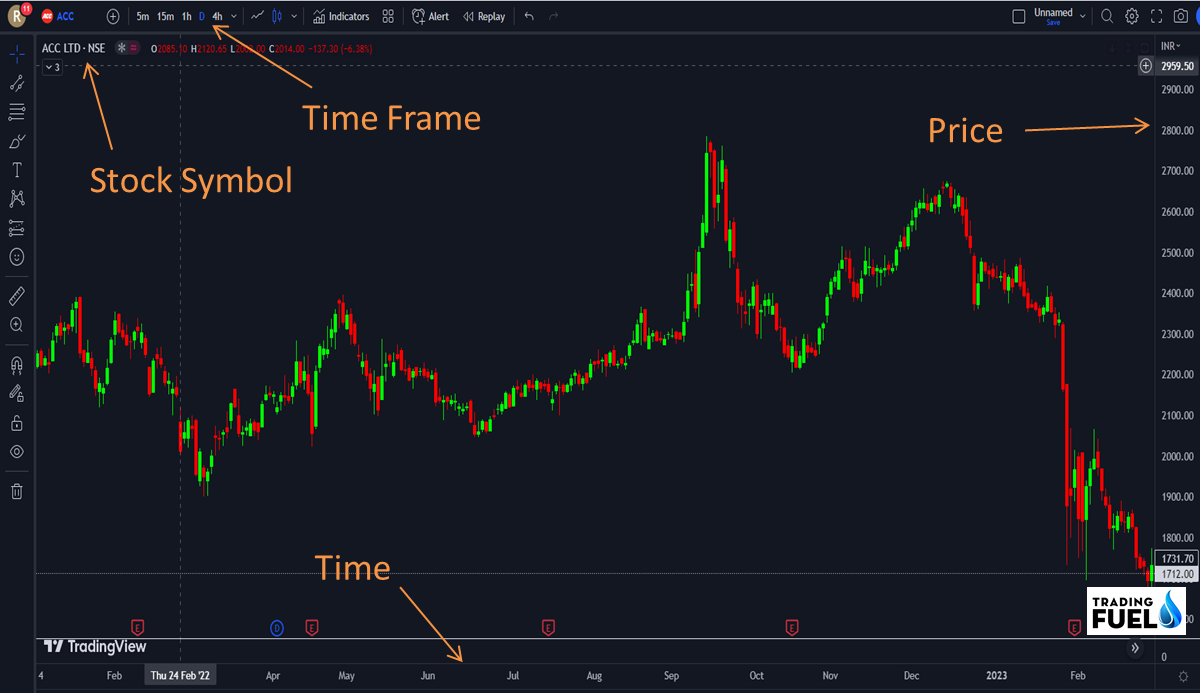
Candlestick charts are a popular tool used to watch an asset’s price changes over time. This method of representation originated in Japan in the 1700s and was widely used before the development of other types of charts like bar and point and figure charts.
Traders frequently rely on candlestick charts to identify changes in asset prices based on past patterns. This technique is a key component of technical analysis, enabling traders to rapidly interpret price information.

What is a Candlestick Chart?
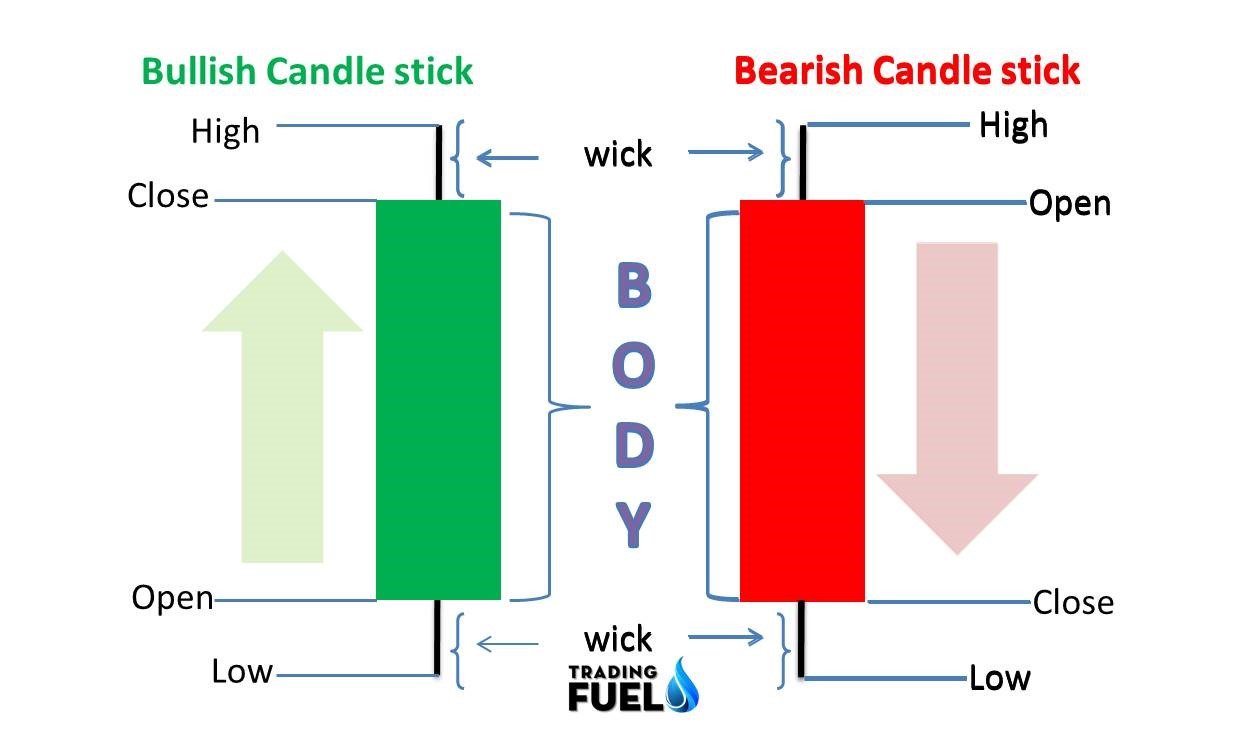
A candlestick chart is a type of financial chart used to track and visualize the price movements of various assets such as currency, securities, or derivatives. It is named after its resemblance to a candlestick, consisting of a vertical rectangular body and wicks extending from the top and bottom.
Candlestick charts display four important price points, namely open, close, high, and low, which aid traders in the trading process. These price points are represented on the chart through certain elements of the candlesticks, which include the body, the wick, and the colour.

The body of a candlestick represents the open-to-close range of the asset, while the wick represents the intraday high-low range.
The colour of the body indicates the direction of the market’s movement. An increase in price is indicated by a white or green body, while a decrease in price is indicated by a red or black body.
Overall, these components of candlestick charts help traders analyse and interpret price movements in a quick and efficient manner.
Must Know: 10 Price Action Candlestick Patterns
What does the candlestick Chart Tell Us?
- Candlestick charts provide valuable insights into market volatility and trends, making them an essential tool for investors and traders seeking a comprehensive analysis before making investment decisions.
- By using technical analysis based on candlestick charts, traders can identify key patterns and trends, which can help them, determine optimal entry and exit points for trades.
- Candlestick charts offer a visual representation of price movements, making it easier for traders to quickly identify trends and patterns in the market.
- This information can be used to develop trading strategies and make informed decisions about when to buy or sell assets. In short, candlestick charts are an integral part of any trader’s toolkit, providing valuable insights into market dynamics and helping them to achieve their investment goals.
Introduction to candlestick patterns
Candlestick patterns are essentially the movements in the price of a stock, represented graphically by candlesticks that can be used as signals or indicators for trading.
These patterns utilize historical price and volume data of a stock to predict its future price movements. If you’re conducting technical analysis, it’s important to be familiar with the various candlestick patterns that you may come across.
There are different types of Candlestick patterns Like Hammer, Doji, Engulfing Patterns, and more.
you will find a detailed blog on our site. Just click the link below and you will find more about candlestick patterns.
Conclusion
Candlesticks charts offer a variety of patterns that help traders identify market movements and changes in asset prices. These patterns can indicate potential opportunities in the market and provide valuable insights into market balance.
For new traders, it is important to understand candlestick patterns and become familiar with them before engaging in trading activities. By learning to recognize these patterns, traders can make informed decisions and increase their chances of success in the markets.
Contain & Image ©️ Copyright By, Trading Fuel || Research Lab

