
Price Action Trading | Meaning, System, Strategies, Patterns & All:
What Is Price Action Trading?
- The Main Theory behind Price Action Trading Is “Price Discount Everything”.
- Whatever News Or Insider Information Someone Has, Its Effect In Price Is Already Discounted.
- Price Action Describe The Characteristics of Underlying Security.
- Price Action Trader Ignores Everything About An Asset Except For What Its Price Has Done In The Past.
- The Tool And Pattern Observed In Price Action Trading Are Simple Price Bar, Price Band, Breakout, High And Low Swing And Trend Lines.
- This Approach Might Seem Counter-Intuitive At First, But It Makes Perfect Sense.
To Understand The Behaviour Of Price, You Need To Understand The Following Concept.
1. SUPPORT AND RESISTANCE:
a. STATIC-SUPPORT:
A Support Level Is A Horizontal Area Where The Price Tend To Find Support As It Falls. This Means That The Price Is More Likely To Bounce Off This Level Rather Than Break It. However, Once The Price Has Breached This Level, It Is Likely To Continue To Fall Until It Finds Another Support Level.

- Once A Support Is A Broker It Acts As A Resistance.
b. STATIC -RESISTANCE:
A Resistance Level Is Opposite Of A Support Level. It Is Where The Price Tend To Find Resistance As It Rises. The Price Is More Likely To Bounce Off This Level Rather Than Break It. However, Once The Price Has Breached This Level, It Is Likely To Continue Rising Until It Finds Another Resistance Level.

- Once A Resistance Is Broken It Act As Support.
- Static Support And Resistance Is A Horizontal Area That Can Be Drawn At High Or Low of a Cycle.
2. DYNAMIC SUPPORT AND RESISTANCE:
What Is The Need Of Dynamic Support Resistance?
- Static Support And Resistance Work Well In A Non-Trending Market.
- If The Market Is In Trending State, Then Dynamic Support And Resistance Became Useful.
- More Commonly Use Dynamic Support And Resistance Tools Are Moving Average.
a. MOVING AVERAGE:
Here An Example Of 20 And 50 Period Moving Average, Watch Closely How In A Powerful Bull And Bear Market, The Correction Is Stopped At Moving Average And Market Continued Its Original Trend After That.
i. DOWNTREND:
- In A Downtrend, Price Do Tend To Take A Halt At The Moving Averages.
- For Example, Price Is In Pull Back And Facing Resistance At The Moving Average 20 And 50.
- If You Are In A Short Position, It Is Better To Book Profit Or Close You Position Once Price Is Sustain Above Short Term Moving Averages.

ii. UPTREND:
- In A Uptrend, Price Do Tend To Take A Halt At The Moving Averages.
- For Example, Price Is In Pull Back And Having Support At The Moving Average 20 And 50.
- If You Are In A Long Position, It Is Better To Book Profit Or Close You Position Once Price Is Sustain Below Short Term Moving Averages.

b. TREND LINES:
“Trend Line Can Be Form By Connection Minimum Two Lows Or Two Highs Of A Trend”.
Characteristics and Uses of Trend Line:
- It Is Inclined At Some Definite Angle.
- If The Angle Of The Trend Line Is Near 45 Degrees It Is A Strong Trend Line.
- It Provides Dynamic Support And Resistance To Price.
- In An Up Trend Line Below Act As A Support, If Price Break Trend Line And Fall, Then Trend Line Will Act As Resistance In Future.
i. UPTREND :

- Uptrend Has A Positive Slope And Is Formed By Connection Two Or More Low Points
- Second Low Must Be Higher Than First To Have Positive Slopes.
Note: At Least Three-Point Must Be Connected Before the Line Is Considered To Be Valid Trend Line
ii. DOWNTREND:

- Down Trend Has A Negative Slope And Is Formed By Connection Two Or More High Points
- Second High Must Be Lower Than First To Have Negative Slopes.
Key Points:
- In An Uptrend, Look For Support and Buying Opportunity.
- In Down Trend, Look For Resistance and Shorting Opportunity.
Dow Theory for Price Action Trading:
“Dow Theory Is The Basic Of The Technical Analysis Of Financial Market. The Basic Idea Of Dow Theory Is That Market Price Action Reflect All Available Information”.
Dow Proposed That Trend Occur In Three Phases.
1) ACCUMULATION:
- During This Phase, Price Is In A Range Bond Market, Moving Between Support And Resistance
- Long Term Moving Averages Are Flat
- Big Broker, Invertor, Institution Are Buying Good Company In This Phase.

2) ADVANCING:
- In A Bull Market, After Breakout Of Upper Boundary Of Accumulation Phase, Price Rise Sharply That Phase Is Called Advancing,
- During End Of This Period, Share Is All Over The News, All-Big Analyst Are Positive, Good Fundamental Are Backing The Rally.
- Mass Participant Occur, All The Retail Trader And Invertor Are Jumping Into Stock Causing Price To rising Move Sharply, Along With Increase Volume.
- Smart-Money Absorbing The Supply With Increasing The Demand.

3) DISTRIBUTION:
- It’s The Final Phase, Those Who Were Holding the Share since Accumulation Phase, Are Now Looking To Book Profit.
- Meanwhile, The Retail Trader Are Astonished By The Advancing Phase, They Look At Distribution As A Pause In The Market, Expectation To Trend Continues.
- Exchange Of Share Happen Here, Form Strong Hand To Weak Hand. As Big Broker, Invertor, Institution Books Profit.
- After This Phase Over Market Decline.

4) DECLINE:
- It Occurs After The Price Break The Low Of The Distribution Phase.
- Price Sustain Below The 200 Moving Averages.
- 200 Moving Average Indicate Down Trend.
- Most Of The Big Investor Already Have Closed The Long Position And Booked Profit.

How To Spot Trend According To Dow?
a. UPTREND:

- In Term Of Dow theory, An Uptrend Is A Formation Of Higher Highs And Higher Lows.
- Whenever The Last Higher Low Of The Rally Is Broken Uptrend Is Said To Be Over.
- Downtrend May Start After The Higher Low Broken And New Lower Lows Is Formed.
b. DOWNTREND:

- In Term of Dow Theory, a Downtrend Is A Formation of Lower High and Lower Lows.
- Whenever Last Lower High Of The Downtrend Is Broken Downtrend Is Said To Be Over.
- Uptrend May Start After Last Lower High Broken and New Higher Lows Is Formed.
CANDLESTICK for Price Action Trading
What Is A Candlestick Chart And What Does It Tell You?
Candlestick Chart Show The Market Open, High, Low, And Close Price For The Day. The Candlestick Has A Wide Part, Which Is Called The Body.

This Real Body Represent The Price Range Between The Open And Close Of The Day When The Real Body Is Filled Green, It Means The Open Was Lower Than The Close. If The Real Body Is Red, It Means The Close Was Higher Than The Open.
Candlestick Can Be Classified As:
a) BULLISH CANDLE:

- Bullish Engulfing.
- Bullish Harami.
- Bullish Kicker.
- Piercing Line.
- Morning Star.
- Three Inside Up.
- 3-White Soldier.
b) BEARISH CANDLE:

- Bearish Engulfing.
- Bearish Harami.
- Bearish Kicker.
- Dark Cloud.
- Evening Star.
- Three Inside Down.
- 3-Black Crows.
c) REJECTION CANDLE:

- Hanging Man And Shooting Star (After An Uptrend)
- Hammer And Inverted Hammer (After A Down Trend)
d) INDECISIVE CANDLE:

- Doji :
- Dragonfly Doji:
- Gravestone Doji:
- Long Legged Doji:
Key Point:
- Bullish Candlestick On A Support Is A Positive Sigh, As It Is Confirming The Validity Of The Support For Long Trade.
- Bearish Candlestick On A Resistance Is A Positive Sigh, As It Is Confirming The Validity Of The Resistance For Short Trade.
- After A Support In Turned Into A Resistance Rejection Candle Occurring At Such Level Valid The Presence Of Resistance, Or Vice Versa.
- Indecisive Candle Represent That Neither Bull Nor Bear Has Won That Day, Reflect The Weakness In Trend.
CHART PATTERN for Price Action Trading:
Why Chart Pattern Occur?
The Main Reason For Repetition Of Chart Patterns Is Mass Phycology Or Group Behaviour, It Has Been Observed That People Behaviours Does NOT Change With Time They Then To React In Same Psychologically Manner Because Of This Chart Patterns Occur.
Completing Price Action Trading Without Discussion The Chart Patterns, Won’t Be Incomplete, Chart Pattern Are One Of The Most Powerful Pattern, Then Can Give You Good Trade Opportunity. There Are Lot Of Chart Patterns As Follow:
- Head & Shoulder and Inverted Head & Shoulder.
- Double Top and Double Bottom.
- Triple Top and Triple Bottom.
- Cup and Handel.
- Wedge Formation.
- Triangle.
For Now, We Are Only Going to Discuss Triangle And How To Trade Them:
- Triangle :
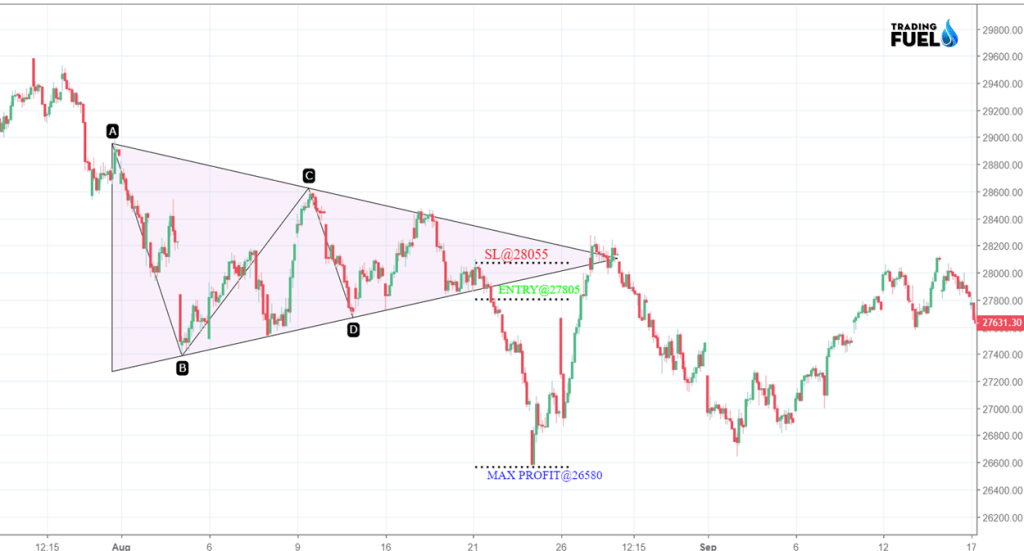
Triangle Are The Continuation Pattern That Occurs In The Direction Of The Trend, When The Price Has Too Far To Fast Under Such Circumstance Sideways Movement Of The Price Occur Which Correct Past Impulsive Move In Term Of Time And Thus Triangles Are Formed.
In Above Example, The Breakout Of Triangle In The Direction Of Trend Would Be A Good Trading Opportunity. Exact Entry, Stop loss, And Exit Level Are Shown in the Picture.
TREND TRADING:
i. Trading Pull Back
In Trading A Pull Back Following Sets Should Be Followed:
- First Spot A Trend In The Market And Trend In The Direction Of Trend.
- 200 MA Is Used Here To Spot A Trend Is The Market, Price Sustain Above 200 MA Is Considered To Be In Uptrend And Sustain Below 200 MA Is Considered To Be In Downtrend.
- After You Have Spotted A Trend, Wait Patiently For Price Pullback Near 200 MA, Look For Rejection Candle Or Bearish Candle For Short Entry.
- In Below Example, A Hammer Formation At 200 MA, Is Indicating The End Of The Pull Back, And For Double Confirmation, The Trend line Break Is Used.

ii. Trading Breakout
In Trading Breakout Following Sets Should Be Followed:
- Spot A Sideways Price Action In The Market.
- Market The Horizontal Lines Of Resistance At Its Boundary.
- After A Candle Breaking And Price Sustain Below Its Resistance Level.
- At Break Out Of the Resistance, Heavy Volume Must Be Present In The Breakout Candle.

Price Action Vs. Indicator:
- Indicators Are Nothing But Some Mathematical Formula Applied To Price That Gives Us Information Like, Oversold, Over Brought, Cross Over Etc.
- Indicators Are Lagging In Nature, First Price Move, And Then Indicator.
- Indicator Is Like To Give False Signal In Sideways Market.
Limitation Of Price Action :
- Interpretation Price Action Is Subjective. It Is Common For Two Trader To Arrive At Different Conclusion When Analysing The Same Price Action.
- The Period Being Used Also Has A Huge Influence On What A Trader Analyse.
- The Past Price Action Is No Guarantee Of Future Price Action, Pattern Tend To Give A False Breakout.
Conclusion
Price Action Provide You Tools Like Support And Resistance, Trend Line, Dow Theory, Breakout And Pull Back To Analyse The Market And For Entry Confirmation You Can Use The Candlestick Pattern Or Chart. Price Action Trading Has Higher Success Ration Then Indicator-Based System, Once You Learn Interpret It, How You Interpret A Particular Set Up Is Depend On You, You Must Practice And Back Test It To Interpret It Correctly. Trading Is A Serious Business There Is No Holy Grail System That Can Give You a 100% Success Rate. Any Trade Can Turn Out To Be In Loss Or Profit. You Should Always Follow Money Management And Proper Risk To Reward.
By, Your Trading Fuel