
In Price Action Trading we look at what price has done in the past and what it is doing now. After knowing the market behavior (past price action) we try to predict what the market will do further.
The majority of price action traders start price action by learning about bar pattern and candlestick pattern, but price action is a broader concept if you are only focused on a few selected patterns you will miss the rich detail provided by price action trader.
In this article, we will focus on the skills of reading Price Action instead of repeating a fancy candlestick name.
1. One Bar Candle:
One bar candle is a graphical presentation of the price for a given period. The most commonly used time units are 5 minutes, 30 minutes, 1 hour, daily, and weekly.
One single bar will represent four essential pieces of information:
- Open (O)
- High(H)
- Low(L)
- Close(C)

When the bar closed higher than it opened, the body is color green. If the bar closed below its opening price we color it red. This colored body is the only difference between the bar and candlestick.
Candlestick represents four important pieces of information in one candle. Apart from this once a price bar completed it will give other critical information for reading price action such as:
- Range
- Body
- Upper tail
- Lower tail
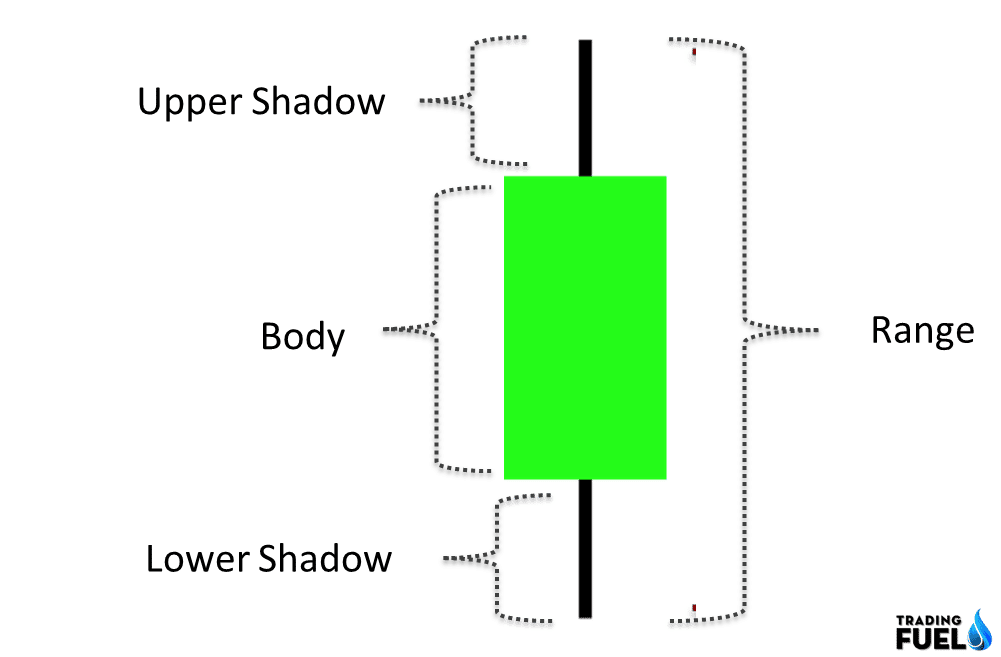
1. Range :
Range refers to the price movement for a selected period. For a single bar, it is the difference between the high and low of that period.
By observing the range of the bar you will be able to know how volatile price remains for that period.
Depending upon the range you will be able to identify trending market and sideways market.
2. Body :
The bar range gives you the extreme of the market which is high and low price.
It is the body that tells you where the market has settled.
Depending on the bar it could be bullish and bearish.
The size of the body demonstrates the strength of the market.
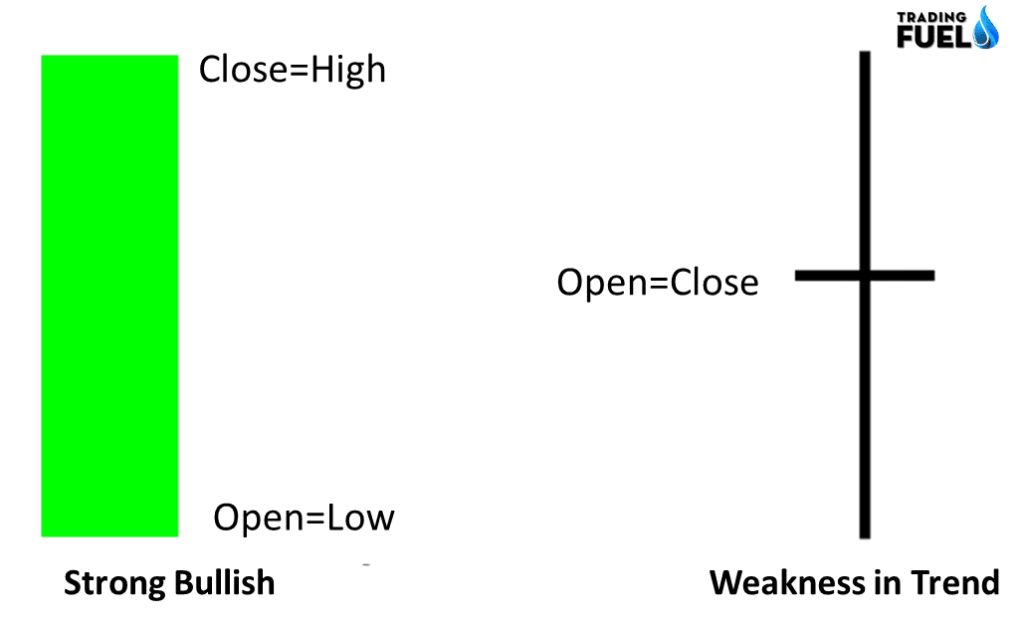
The candlestick on the left has no tail, open is equal to low, and high is equal to close. It is the strongest form of candle having the highest upward momentum.
The candlestick on the right has no body, open is equal to close. It is a form of candle indicating the weakness of both bulls and bears.
In candlestick terminology, the right side candle is called marubozu and the left one is doji.
While observing a candle you should be about to answer these questions.
Trend of the market? Up or Down
Strength of this Move?
3. Upper Shadow :
Once you can completely understand what the range and body of each bar signify, you will be able to appreciate what the upper shadow represents.
The upper shadow shows the area where the price was pushed but the price is unable to sustain in this region.
It shows that the sellers are more aggressive and overpower the buyer in that region.
Hence the upper shadow measures the selling pressure if the shadow is longer it represents higher selling pressure.

4. Lower Shadow
By applying the same logic as of upper shadow, you will find the buying pressure of each bar.
2. Two Bar Candle:
Till now we have studied the importance of one bar candle. Now we will shift our focus to two bar candles, as two bar take twice as much time as one bar they have more significance in understating price action behaviors.
1. Price Action:
- Earlier when we were studying one bar candle, we were unable to determine whether the range of the candle is wide or narrow.
- We can overcome this difficulty with two bar candles by comparing the second bar with the first one.
- A wide range of bar points to a high volatility period.
- With two bars we get more data to form the same candle, as the first bar provides a benchmark for the second bar.
- There are many two-bar candlestick Patten which is actively used by professional traders in their daily analysis.
- By comparing any two previous candles one can see that both the candle is validating each other view or not.

From the chart above we have randomly picked two-bar combinations to explain how to look at two bar candles.
- The second candle was a relatively smaller candle, market volatility decreased with a decrease in bar range.
- Two continues bearish candle forming lower lows showing bearishness in the market.
- The market volatility decreased as the range of candles narrow, indicating a possible big move in the market.
2. Testing Price Level:
The concept of testing means the market is moving toward the price level(zone) to test whether the price is rejected form that particular zone or not.
The high and low of a candle will act as a support and resistance level.
The test of these extremer (high and low) levels will show the true behavior of the market.
This chart is the same as the previous one, but here we will be more focused on how the price is reacting at high and low levels.

- The second bar breaks the high of the first bar but rejected.
- The second bar forms a narrow range, indicating a decrease in volatility. as the close and open are near to each other which shows indecisiveness in the market.
- After doji candle, the second candle is small range candles which show market is uncertain in term of direction.
Two bar analysis allow us to see a bigger picture of the price action and it brings more depth into our price action analysis.
3. Three Bar Candle:
After clearly understanding the two-bar price action, we are now able to see what price is doing and what to expect in the future.
Now we would expect the market to move in a specific way in the third bar.
The confirmation or failure of our expectation give hint about the market state and it adds to our price action analysis.
Market move in trend, if the market sentiment is bullish it remains bullish until the trend is reversed.
Keep in mind we are only focusing on three bar candles here which reflects the short term trend of the market.

Here we are randomly selecting three-bar combinations from the chart. With the help of the first two bars, we form either a bullish or bearish view. Then the third bar either confirm or reject our view.
- Frist bar form a bullish candle with good strength (body size), the second candle form a narrow range bar showing indecision and weakness. Hence we expect that third bar to be a bearish candle. The third bar breaks the low of the second candle indicating bearishness in the market.
- The first two bars are narrow range and show indecisions of both bulls and bear as there is no clear trend in the market. We can expect the third candle to break the range and a new trend will continue in that direction, as we expected the third candle to break the low of both candles and closed below the lows. It is clear that the market is in a downtrend and further selling pressure is expected.
Reading Price Action:
Three bar analysis forms the foundation for reading price action.
After hours of practice, you will be able to spot and understand such price formation.
Then you can grow your price reading skills, you need no label or name except when you are communicating with other traders.
For example, we have picked two different price formations and have explained each bar:
a. Evening Star Pattern:
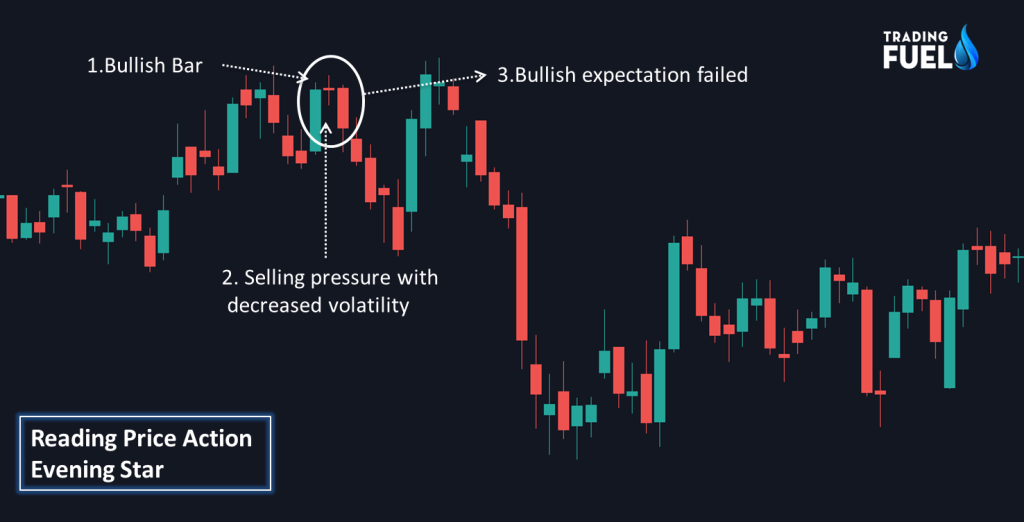
This chart top out with an evening star pattern, we will see how we can read such a candle.
- The long body of the bullish candle implied the bullishness.
- The second candle is a Doji, indicating a change in market sentiment and weakness in the underlying trend.
- However, instead of rising and continue of trend Marker fall, the expectation of bullishness fails and presents a bearish setup.
b. Pin Bar:

- The first bar was a nice bullish bar.
- The second bar shows strong selling pressure as the price is unable to sustain the upper price level and strong selling hammer the price. Such price formation is called a shooting star. Our expectation for the third bar is a bearish bar
- The third candle was a bullish but thing to note is that it form a new low and fail to break the high of the previous candle forming a weak structure according to dow theory that is the lower low formation
Conclusion:
In this blog, we have explained a proper way of reading price action for simplicity, we have categorized the theory into one bar, two bar, and three bar formation. price action trading is an art more than science. Skill to read the market sentiment hidden behind the price can only be developed by practice. Learning price action is a slow but effective way to develop chart reading skills.
Contain & Image ©️ Copyright By, Trading Fuel Research Lab