
The Supertrend indicator was developed by Olivier Seban. It works at all the time frames i.e. 1 minute, 5 minutes, or 15 minutes.
- The Supertrend Indicator is simply one of the easiest trend trading systems. Furthermore, it is very effective.
- Supertrend, as the name suggests, is a trend-following indicator. It works much better than moving averages and MACD which are also useful trend-following indicators.
- Supertrend is a trending indicator. Moreover, just like all trending indicators, it works well in trending markets (i.e. in uptrends and downtrends).
- Supertrend is built using two parameters, and the commonly used ones are 10 and 3.
- If you are a day trader, then you can use other indicators along with the Supertrend indicator to confirm the signal.
Supertrend Indicator Formula and Calculation
- The Supertrend indicator shows trend direction. In addition, it provides buy or sell indicators.
- It predicts using a mixture of the average price rate in today’s period along with a volatility indicator.
- The ATR indicator is useful in form of a volatility indicator.
Quotes by TradingView
Calculation of Values as per Formula :
BASIC UPPER BAND = (HIGH + LOW) / 2 + Multiplier* ATR
BASIC LOWER BAND = (HIGH + LOW) / 2 – Multiplier* ATR
FINAL UPPER BAND = IF ((Current BASIC UPPERBAND< Previous FINAL UPPER BAND) and (Previous close < Previous FINAL LOWER BAND)) THEN (Current BASIC LOWER BAND) ELSE Previous FINAL LOWER BAND)
FINAL LOWER BAND = IF( (current BASIC LOWER BAND > Previous FINAL LOWER BAND) and (Previous Close < Previous FINAL LOWER BAND) ) THEN (Current BASIC LOWER BAND ) ELSE Previous FINAL LOWER BAND )
SUPER TREND = IF (Current Close <= Current FINAL UPPER BAND) THEN current FINAL UPPER BAND ELSE Current FINAL LOWERBAND
Calculation of Average True Range :
[(Prior ATR × 13) + Current TR] / 14
Here, 14 indicates a period. Therefore, the derivation of ATR is by multiplying the previous ATR with 13. Furthermore, add the latest TR and divide it by Period.
How to Use Supertrend Indicator?
To use Supertrend, you can follow these steps:
- Open the chart of a particular stock you want to trade. [Nifty Live Chart with Super Trend]
- Set the time interval of 10 minutes for intraday trading. For that, you can use any good charting software.
- Insert Supertrend as your Indicator. In addition, keep setting as 10 & 3. In fact, it is possible to insert your own setting as well.
- Now start tracking when signals are in your favor. Furthermore, follow the arrows for the signals to buy and sell the stocks.
Using S.T., you can analyze any stock technically. In fact, it gives signals to go for long or short on confirmation of the trend. Furthermore, it works best in a trending market. For instance, the uptrend or downtrend can be known in any type of market.
While using a super trend indicator, it is better to put stop loss. In fact, you can use the indicator line to stop loss. In addition, you can also trail it as the price move in either direction. Therefore, using Supertrend along with your stop loss pattern is the best way to earn good returns in trading.
Supertrend Trading Strategy for Buy and Sell:
The main crux for intraday traders is to identify buying and selling signals in Supertrend.
Supertrend represents the downtrends and uptrends. In fact, the flipping of the indicator over the closing price indicates a signal.
- The green color indicates a buy signal
- The red color indicates a sell signal
- A sell signal occurs when it closes above the price.
Double Supertrend Trading Strategy:
Follow the steps given below to apply this strategy for Intraday trading.
- This strategy works above 15 minutes.
- Input Supertrend indicator with parameters 2 and10(green color).
- Input another Supertrend indicator with parameters 3 and 10 (red color).
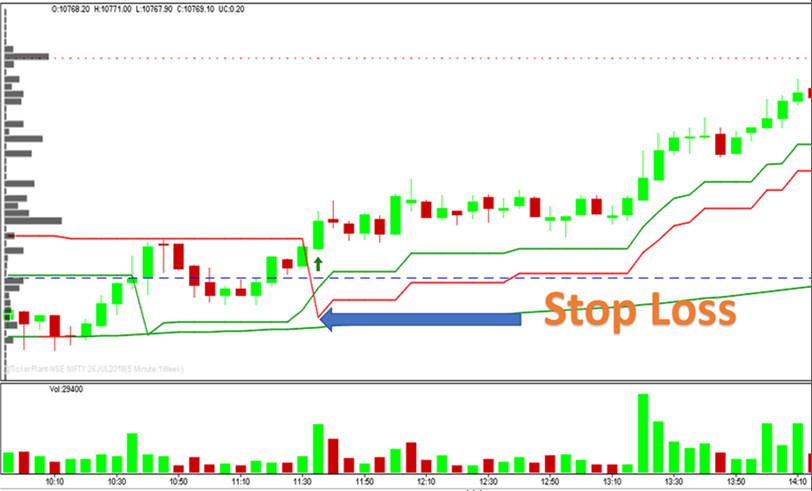
⬆ For Buy signal :
When it generates buy signals, you can put your stop loss at the red Supertrend indicator, as shown below image.
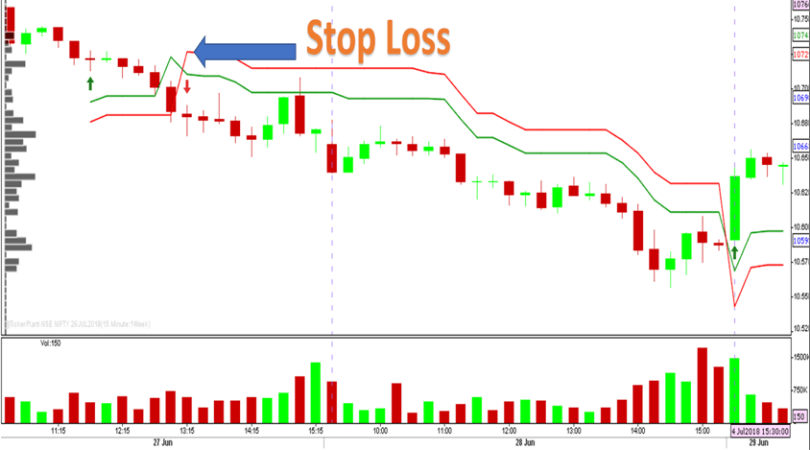
⬇ For Sell Signal :
When it generates sell signals, you can put your stop loss at the red Supertrend indicator, as shown below Image.
Note: You can use 4, 10 parameters with 200 EMA in a single super trend for best results in Nifty.
Advantages Supertrend Indicator
As per many experts, Super Trend is best to use in combination with other indicators like MACD and RSI.
- The best thing about Supertrend is it sends out accurate signals.
- This indicator sends signals at a precise time.
- It is available on various platforms free of cost.
- The indicator offers the quickest technical analysis to intraday traders.
- Easy for intraday traders to make faster decisions.
- It is easy to use and understand.
Disadvantages Supertrend Indicator
- The Super Trend is not appropriate for all situations.
- It works when the market is trending.
- Supertrend uses only the two parameters of ATR and Multiplier. They are not sufficient under certain conditions to predict the accurate direction of the market.
Learn More About: Best Intraday Trading Indicators
Note: Supertrend indicator is not accurate for all situations. It shows the different results for different stocks. Before using this best indicator for trading, one should backtest it by applying different parameters for different stocks.
FAQs
Supertrend AmiBroker AFL
_SECTION_BEGIN("TF Best SuperTrend AFL");

SetChartOptions( 0, chartShowArrows | chartShowDates );
Plot( C, "Close", ParamColor( "Color", colorBlack ), styleNoTitle | ParamStyle( "Style" ) | GetPriceStyle() );

SetBarsRequired( 100000, 0 );

atr2 = Param( "ATR1 Factor", 3, 1, 5, 0.1 );
per2 = Param( "ATR1 Period", 10, 3, 100, 1 );
atr1 = Param( "ATR2 Factor", 5, 1, 20, 0.1 );
per1 = Param( "ATR2 Period", 10, 3, 100, 1 );


SetPositionSize( 1, spsShares );

UpBand1 = ( H + L ) / 2 + ( atr1 * ATR( per1 ) );
DnBand1 = ( H + L ) / 2 - ( atr1 * ATR( per1 ) );
indi1 = ATR( per1 );
RessArray = SuppArray = Null;
trend[0] = 1;
changeOfTrend = 0;
flag = flagh = 0;

UpBand2 = ( H + L ) / 2 + ( atr2 * ATR( per2 ) );
DnBand2 = ( H + L ) / 2 - ( atr2 * ATR( per2 ) );
indi2 = ATR( per2 );
RessArray2 = SuppArray2 = Null;
trend2[0] = 1;
changeOfTrend2 = 0;
flag2 = flagh2 = 0;


for ( i = 1; i < BarCount; i++ )
{

trend[i] = 1;
trend2[i] = 1;


if ( Close[i] > UpBand1[i-1] )
{
trend[i] = 1;

if ( trend[i-1] == -1 )
changeOfTrend = 1;
}
else
if ( Close[i] < DnBand1[i-1] )
{
trend[i] = -1;

if ( trend[i-1] == 1 )
changeOfTrend = 1;
}
else
if ( trend[i-1] == 1 )
{
trend[i] = 1;
changeOfTrend = 0;
}
else
if ( trend[i-1] == -1 )
{
trend[i] = -1;
changeOfTrend = 0;
}

if ( Close[i] > UpBand2[i-1] )
{
trend2[i] = 1;

if ( trend2[i-1] == -1 )
changeOfTrend2 = 1;
}
else
if ( Close[i] < DnBand2[i-1] )
{
trend2[i] = -1;

if ( trend2[i-1] == 1 )
changeOfTrend2 = 1;
}
else
if ( trend2[i-1] == 1 )
{
trend2[i] = 1;
changeOfTrend2 = 0;
}
else
if ( trend2[i-1] == -1 )
{
trend2[i] = -1;
changeOfTrend2 = 0;
}

if ( trend[i] < 0 && trend[i-1] > 0 )
{
flag = 1;
}
else
{
flag = 0;
}

if ( trend[i] > 0 && trend[i-1] < 0 )
{
flagh = 1;
}
else
{
flagh = 0;
}

if ( trend[i] > 0 && DnBand1[i] < DnBand1[i-1] )
{
DnBand1[i] = DnBand1[i-1];
}

if ( trend[i] < 0 && UpBand1[i] > UpBand1[i-1] )
{
UpBand1[i] = UpBand1[i-1];
}

if ( flag == 1 )
{
UpBand1[i] = ( H[i] + L[i] ) / 2 + ( atr1 * indi1[i] );;
}

if ( flagh == 1 )
{
DnBand1[i] = ( H[i] + L[i] ) / 2 - ( atr1 * indi1[i] );;
}


if ( trend2[i] < 0 && trend2[i-1] > 0 )
{
flag2 = 1;
}
else
{
flag2 = 0;
}

if ( trend2[i] > 0 && trend2[i-1] < 0 )
{
flagh2 = 1;
}
else
{
flagh2 = 0;
}

if ( trend2[i] > 0 && DnBand2[i] < DnBand2[i-1] )
{
DnBand2[i] = DnBand2[i-1];
}

if ( trend2[i] < 0 && UpBand2[i] > UpBand2[i-1] )
{
UpBand2[i] = UpBand2[i-1];
}

if ( flag2 == 1 )
{
UpBand2[i] = ( H[i] + L[i] ) / 2 + ( atr2 * indi2[i] );
}

if ( flagh2 == 1 )
{
DnBand2[i] = ( H[i] + L[i] ) / 2 - ( atr2 * indi2[i] );
}

if ( trend[i] == 1 )
{
RessArray[i] = DnBand1[i];

if ( changeOfTrend == 1 )
{
RessArray[i-1] = SuppArray[i-1];
changeOfTrend = 0;
}
}
else
if ( trend[i] == -1 )
{
SuppArray[i] = UpBand1[i];

if ( changeOfTrend == 1 )
{
SuppArray[i-1] = RessArray[i-1];
changeOfTrend = 0;
}
}

if ( trend2[i] == 1 )
{
RessArray2[i] = DnBand2[i];

if ( changeOfTrend2 == 1 )
{
RessArray2[i-1] = SuppArray2[i-1];
changeOfTrend2 = 0;
}
}
else
if ( trend2[i] == -1 )
{
SuppArray2[i] = UpBand2[i];

if ( changeOfTrend2 == 1 )
{
SuppArray2[i-1] = RessArray2[i-1];
changeOfTrend2 = 0;
}
}

}

prevH = TimeFrameGetPrice( "H", inDaily, -1 );

prevL = TimeFrameGetPrice( "L", inDaily, -1 );
Cond01 = 1;//H<PrevH;
Cond02 = 1;//L>PrevL;


Buy1 = Cross( O, Ref( RessArray, -1 ) ) AND Ref( RessArray, -1 ) > 0;
Sell1 = Cross( Ref( SuppArray, -1 ), O ) AND Ref( SuppArray, -1 ) > 0;
Buy = Buy1 AND Cond02;
Sell = ( Ref( SuppArray2, -1 ) > O AND Ref( SuppArray2, -1 ) > 0 );
Buy = ExRem( Buy, Sell );
Sell = ExRem( Sell, Buy );

Short = Sell1 AND Cond01;
Cover = ( O > Ref( RessArray2, -1 ) AND Ref( RessArray2, -1 ) > 0 ) ;
Short = ExRem( Short, Cover );
Cover = ExRem( Cover, Short );


Plot( RessArray, "First Support", colorGreen );
Plot( SuppArray, "First Resistance", colorRed );
Plot( RessArray2, "Second Support", colorGreen );
Plot( SuppArray2, "Second Resistance", colorRed );

Title = NumToStr( DateTime(), formatDateTime ) + " O " + O + " H " + H + " L " + L + " C " + C +
"\nFirst Support: " + RessArray + " First Resistance: " + SuppArray + " Second Support: " + RessArray2 + " Second Resistance " + SuppArray2;


PlotShapes( IIf( Buy, shapeSquare, shapeNone ), colorGreen, 0, L, Offset = -40 );
PlotShapes( IIf( Buy, shapeSquare, shapeNone ), colorLime, 0, L, Offset = -50 );
PlotShapes( IIf( Buy, shapeUpArrow, shapeNone ), colorWhite, 0, L, Offset = -45 );
PlotShapes( IIf( Sell, shapeDownArrow, shapeNone ), colorRed, 0, H, Offset = -45 );
PlotShapes( IIf( Short, shapeSquare, shapeNone ), colorRed, 0, H, Offset = 40 );
PlotShapes( IIf( Short, shapeSquare, shapeNone ), colorOrange, 0, H, Offset = 50 );
PlotShapes( IIf( Short, shapeDownArrow, shapeNone ), colorWhite, 0, H, Offset = -45 );
PlotShapes( IIf( Cover, shapeUpArrow, shapeNone ), colorBlue, 0, L, Offset = -45 );

_SECTION_END();
view rawSupertrend AmiBroker AFL hosted with ❤ by Trading Fuel