The MACD (Moving Average Convergence Divergence) indicator is a widely used technical analysis tool for trading stocks, forex, and other financial instruments. It was developed by Gerald Appel in the late 1970s. The MACD is a momentum indicator that helps traders identify potential trend reversals and trend strength.
Calculation of MACD:
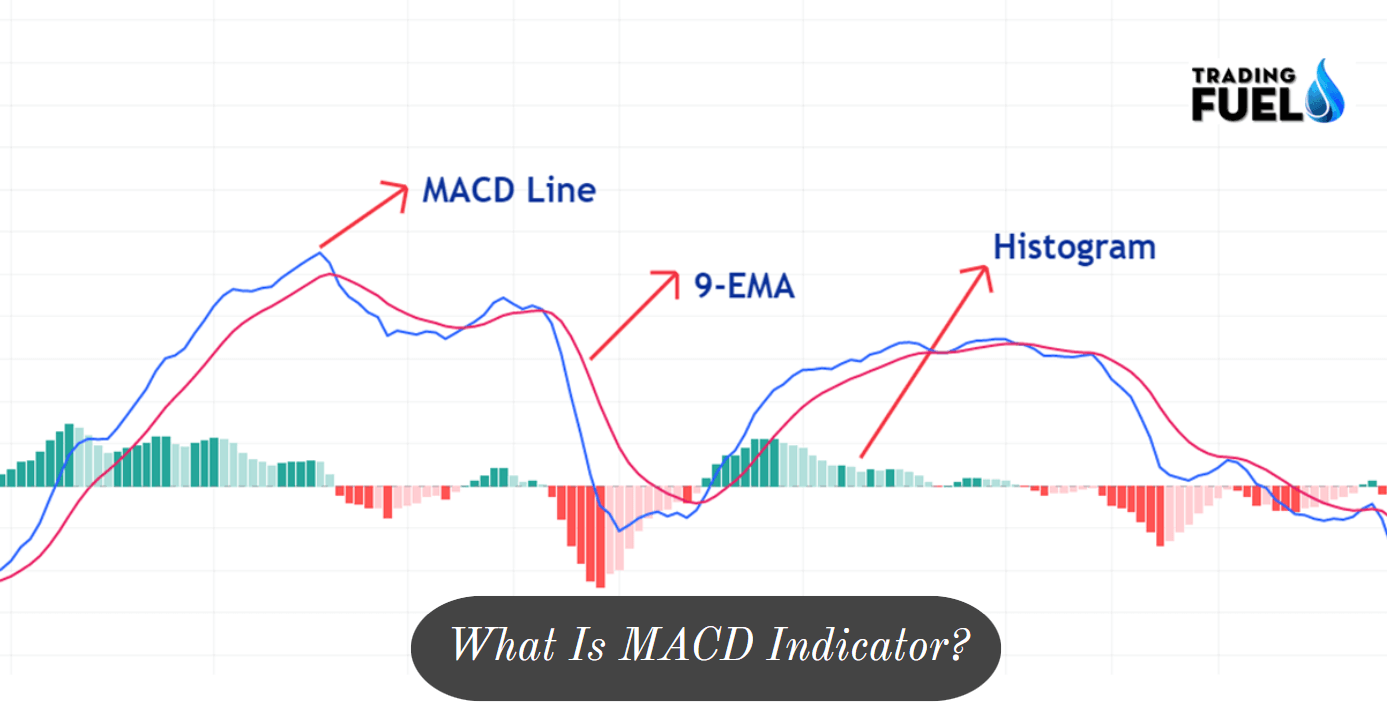
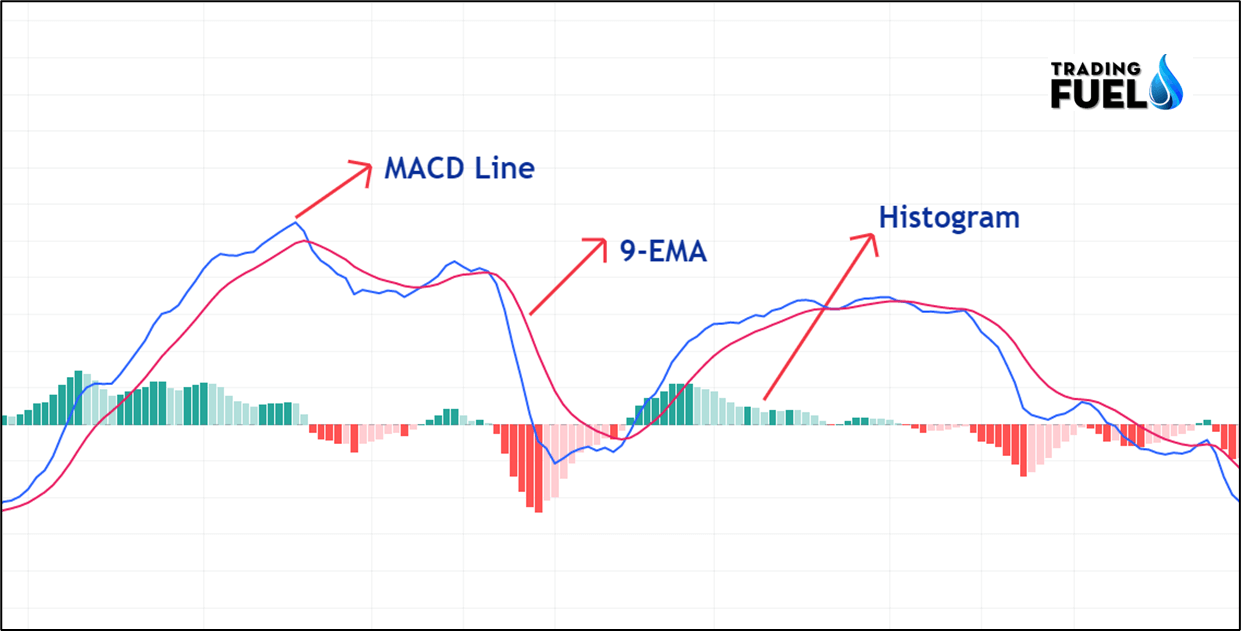
The MACD is calculated by subtracting the 26-period exponential moving average (EMA) Value from the 12-period EMA Value. The resulting line is referred to as the MACD line. The MACD line is then plotted against a 9-period EMA of the MACD line, which is referred to as the signal line. Traders also often plot a histogram to show the difference between the MACD line and the signal line.
Components of MACD Indicator
The MACD (Moving Average Convergence Divergence) indicator consists of three components:
- The MACD Line: The difference between a 12-day exponential moving average (EMA) and a 26-day EMA of the price.
- The Signal Line: A 9-day Exponential Moving Average of the MACD Line.
- The Histogram: The difference between the MACD Line and the Signal Line, represented as a vertical bar chart.
Use of MACD
One of the key uses of the MACD is to help traders determine when to buy and sell an asset. The MACD is considered to be a bullish signal when it rises above the signal line, and a bearish signal when it falls below the signal line. In addition, a positive MACD histogram indicates increasing momentum, while a negative histogram indicates decreasing momentum.
Another common use of the MACD is to identify trend reversals. A bearish divergence between the MACD and price occurs when the price is making new highs but the MACD is not confirming this strength, suggesting that momentum is waning and a trend reversal may be imminent. Similarly, a bullish divergence occurs when the price is making new lows while the MACD is not confirming this weakness, suggesting a trend reversal may be in the works.
How to Trade Using MACD?
The MACD indicator can be used in several ways by traders to help make informed trading decisions.
Here are common methods used by traders to use the MACD:
- Crossover signals: The MACD line and the signal line often generate buy and sell signals when they cross.
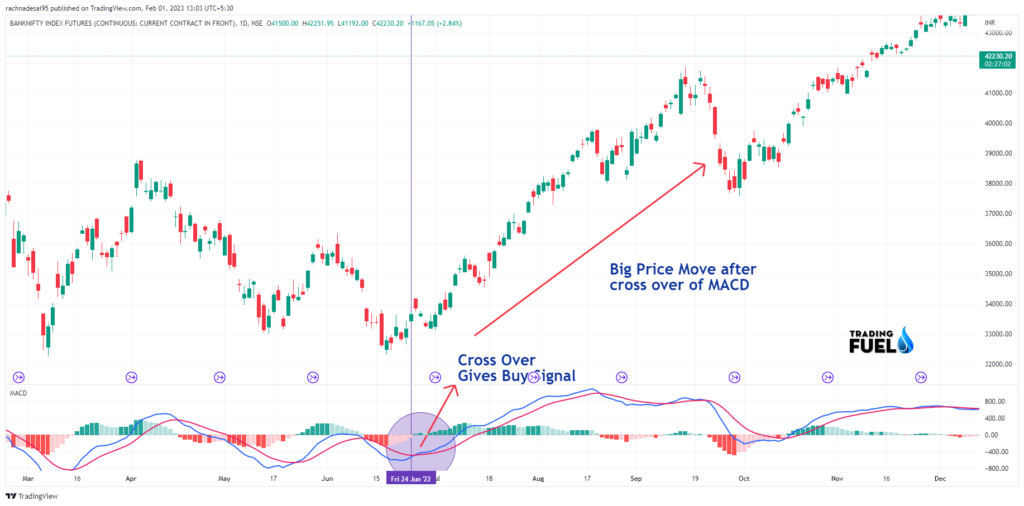
A bullish crossover occurs when the MACD line crosses above the signal line, which is a buy signal. Conversely, a bearish crossover occurs when the MACD line crosses below the signal line, which is a sell signal.
You also like: Best Intraday Trading Indicators
- Divergence signals: Traders often use the MACD to identify divergences between the MACD line and the price of the underlying asset.
A bullish divergence occurs when the price is making new lows while the MACD is not confirming this weakness, suggesting that momentum may be turning bullish and a trend reversal may be in the works.
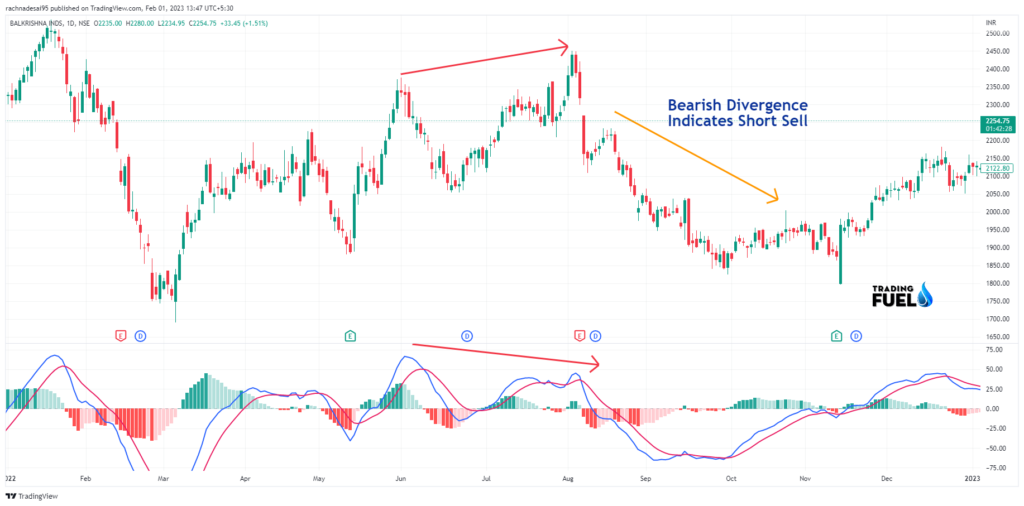
Conversely, a bearish divergence occurs when the price is making new highs while the MACD is not confirming this strength, suggesting that momentum may be turning bearish and a trend reversal may be imminent.
- Trend strength: The MACD histogram can be used to assess the strength of a trend. A positive MACD histogram indicates increasing momentum, while a negative histogram indicates decreasing momentum.
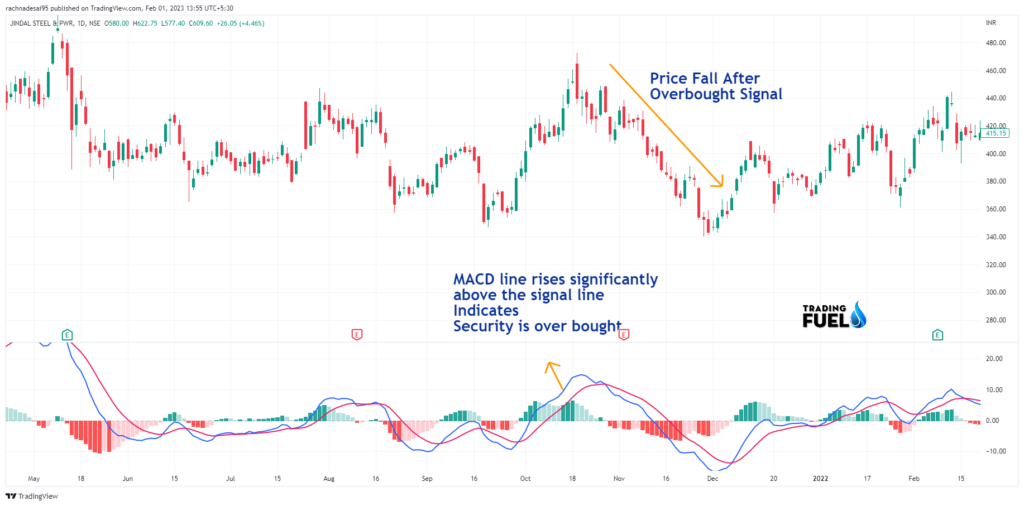
- Overbought/oversold conditions: The MACD line can also be used to assess overbought and oversold conditions.
When the MACD line rises significantly above the signal line, it can indicate that the asset is overbought, and a potential sell signal.
Conversely, when the MACD line falls significantly below the signal line, it can indicate that the asset is oversold, and a potential buy signal.
It’s important to note that the MACD is just one of many technical indicators used by traders, and each indicator has its own strengths and weaknesses. Traders often use a combination of indicators to help make informed trading decisions, and the MACD can be a valuable tool when used in conjunction with other analysis methods and tools.
Download MACD For Amibroker (AFL)
// Downloaded From https://www.tradingfuel.com
_SECTION_BEGIN("MACD");
r1 = Param( "Fast avg", 12, 2, 200, 1 );
r2 = Param( "Slow avg", 26, 2, 200, 1 );
r3 = Param( "Signal avg", 9, 2, 200, 1 );

r1 = Optimize( "Fast avg", r1 , 2, 200, 1 );
r2 = Optimize( "Slow avg", r2 , 2, 200, 1 );
r3 = Optimize( "Signal avg", r3 , 2, 200, 1 );

Plot( ml = MACD(r1, r2), StrFormat(_SECTION_NAME()+"(%g,%g)", r1, r2), ParamColor("MACD color", colorRed ), ParamStyle("MACD style") );
Plot( sl = Signal(r1,r2,r3), "Signal" + _PARAM_VALUES(), ParamColor("Signal color", colorBlue ), ParamStyle("Signal style") );
Plot( ml-sl, "MACD Histogram", ParamColor("Histogram color", colorBlack ),
styleNoTitle | ParamStyle("Histogram style", styleHistogram | styleNoLabel, maskHistogram ) );


Buy= Cross(ml , sl);
Sell= Cross( sl, ml);

PlotShapes( Buy * shapeUpArrow + Sell * shapeDownArrow, IIf( Buy, colorGreen, colorRed ) );


AlertIf( Buy , "SOUND C:\\Windows\\Media\\chimes.wav", "Audio alert", 2 );
AlertIf( Sell , "SOUND C:\\Windows\\Media\\alert.wav", "Audio alert", 2 );

_SECTION_END();
Contain & Image ©️ Copyright By, Trading Fuel || Research Lab