What Is Price Action Trading? (Beginner to Expert Guide):
Definition of Price Action Trading:
- Price Action Trading is the way to watch the market price movement and predict future price movements.
- It uses past and current price movements to anticipate future price movements.
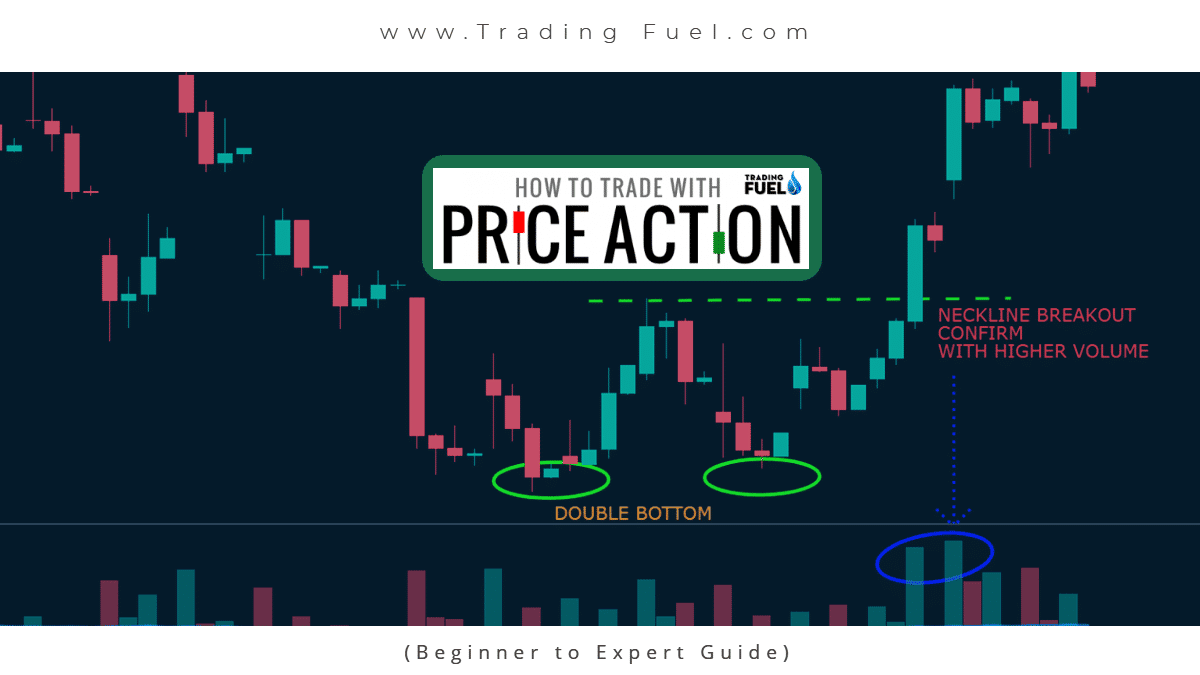
- The conventional form of technical analysis focuses on different chart patterns like head and shoulder, flag, double bottom, and double top
- Price action trading focuses more on the specific price formation that reflects market sentiment either bullish or bearish like an inside bar, pin bar, engulfing candlestick, hammer, evening star, and harami candlestick.
- Price action trading can be used along with any suitable technical indicator to spot a trading signal confirming our view or our price action analysis.
- In pure price action trading, no technical indicator is used, however price action and indicators are not so different, as a technical indicator is the outcome of some mathematical formulas that are applied to price itself.
Origin of Price Action Trading:
1. Dow Theory:
- Dow Theory was developed by Charles Dow in the 19th century.
- Both the price action trading and technical analysis have the same base, as they are proposed by Charles Dow.
- Dow Theory is based on understanding the different market conditions and market behavior.
- The current price of share discounted all known information about the share, both its negative and positive effect.
Six tenets behind Dow Theory:
- Price discounts everything.
- The market has three trends, primary, secondary and minor trends.
- The major trend has four-phase, accumulation, advance, distribution, and decline.
- The index must confirm each other.
- The volume must confirm the trend.
- Trend will continue its original path until it signals a trend reversal.
2. Candlestick Pattern:

- A candlestick pattern is a graphical representation that is used to show the current market sentiment; bullish, bearish, or sideways movement.
- It gives you a lot of information. It shows you the open, close, high, and low prices for the specific time frame.
- Candlestick pattern is like a template, it doesn’t always look the same but it does represent the same market psychology that could be used to predict market direction.
- It is not difficult to read a candlestick chart and it has two main parts candlestick body and shadow.
- The body is the part that looks like the body of the candle. Shadow is the part that looks like a wick.
- Candlestick shadow can extend from both the top and bottom of the body.
The body tells you three things
- The opening price.
- The closing price
- Whether the share price went up or down.
The shadow tells you two things.
- Day high, as shadow high is day high
- Day low, as shadow low is day low
- Green candle shows the open price is at the bottom and the closing price is at the top it represents the bullish movement.
- Red candle shows the open price is at the top and the closing price is at the bottom it represents the bearish movement.
What candlestick tells you?
Price action: weak or strong.
Trend: bullish or bearish.
Who is in control of buyers or sellers?
Is there a lack of a buyer or seller?
Market for Price Action Trading:
1. Market swings:

Marker price move in waves, such waves are also called swing
- In price action, if the market is forming higher high and higher low it is interpreted as an uptrend.
- In price action, if the market is forming lower low and lower high it is interpreted as a downtrend.
Know About: What Is Swing Trading?
Elliot wave is a theory on the behaviors of market swing proposed by Ralph Nelson Elliott
2. What is Elliot wave?

- Elliot wave is a form of technical analysis in which Ralph has proposed that as the market moves in trend these moves can further be classified and studied in detail.
- He proposes that moves in the waves can either be impulsive and corrective.
- The combination of their different impulse and corrective moves, give rise to the different possibility of wave behaviors.
- Ralph Nelson Elliot has explained in detail the various concept of Elliot wave.
- An impulse wave is marked as 1-2-3-4-5; the corrective wave is marked as A-B-C.
- Elliot proposed that market complete its one cycle after one impulse and corrective move, which is after a cycle of 8 waves which contain five sub-wave of an impulse wave and 3 sub-wave of a corrective wave.
Know More About: Elliot Wave Theory
3. Support and Resistance:

Supply and demand are the forces that cause such price swings. If the demand is greater than the supply market will rise and the market will fall if the supply is higher than demand.
- Price action trading all about finding support and resistance.
- Support: At the support level, we expect the demand of the share to overcome its supply, as a result of the price rise or it would stop failing as the supply is being absorbed at such level.
- Resistance: At resistance level, we expect the supply of the share to overcome its demand, as a result of the price fall or it would stop rising as the demand is being absorbed at such level.
- Swing low and swing high also provide support and resistance to the current price depending on its direction.
Note: Support and resistance are not a clear cut price level it is rather a zone form where either demands or supply rise or fall depending on the market trend.
Know More About: Demand & Supply Zone
4. Trend line & Channels:
Trend line:
Trend line form by connecting the swing high and swing low, it acts as a support and resistance zone, as the majority of traders are waiting to enter into the trade after the retest of the trend line.
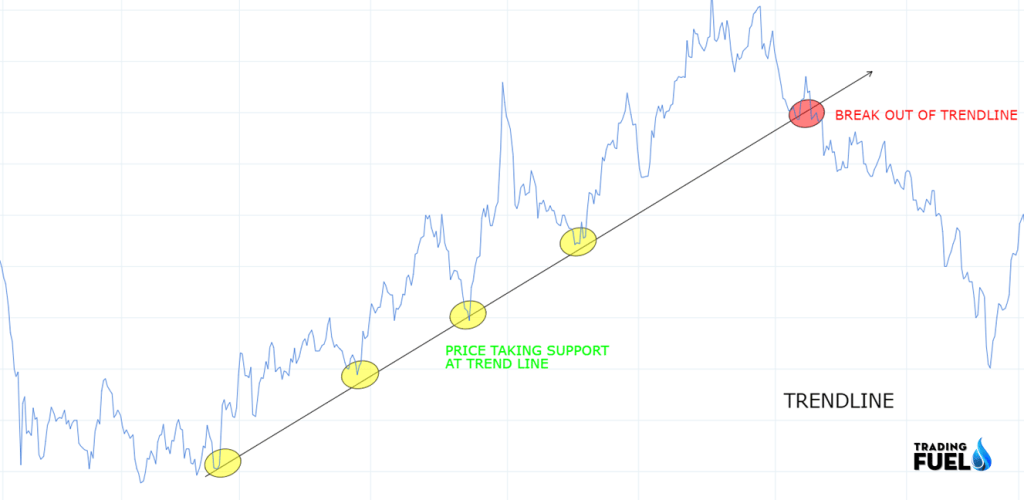
- In an uptrend market trend line can be formed by connecting the swing low that is higher low of the uptrend.
- In a downtrend market trend line can be formed by connecting the swing high that is lower high of the downtrend.
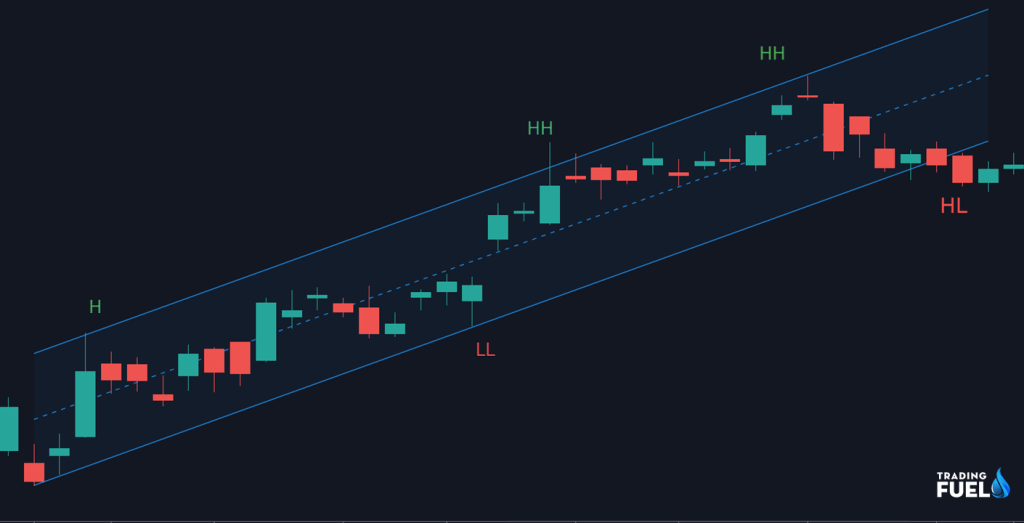
Channel:
If there is a balance of force between the seller and buyer, then sometimes price tends to be oscillating within two parallel lines such formation is called a channel.
One trend line is formed by connecting the swing low and another by connecting swing high.
Price Action Trading Method:
1. Price Action with Volume:

Volume: volume is a measure of how many times an asset is being traded within a given period, the volume is an indication of the market strength and it also spots weakness in the trend.
- One of the tenets of Dow Theory is that volume should increase in the direction of the main trend and decreasing in the opposite direction.
- Volume indicates the participant of the buyer and seller.
- Price increasing with increasing volume is a confirmation that the trend is likely to be continued.
- If the rise in the price is not supported by a rise in the volume it is considered to be a fake move.
- Combining volume analysis with price action trading leads to the development of volume spread analysis, which is based on the relationship between the volume and ranger of the price bars.
2. Price Action with Indicator:
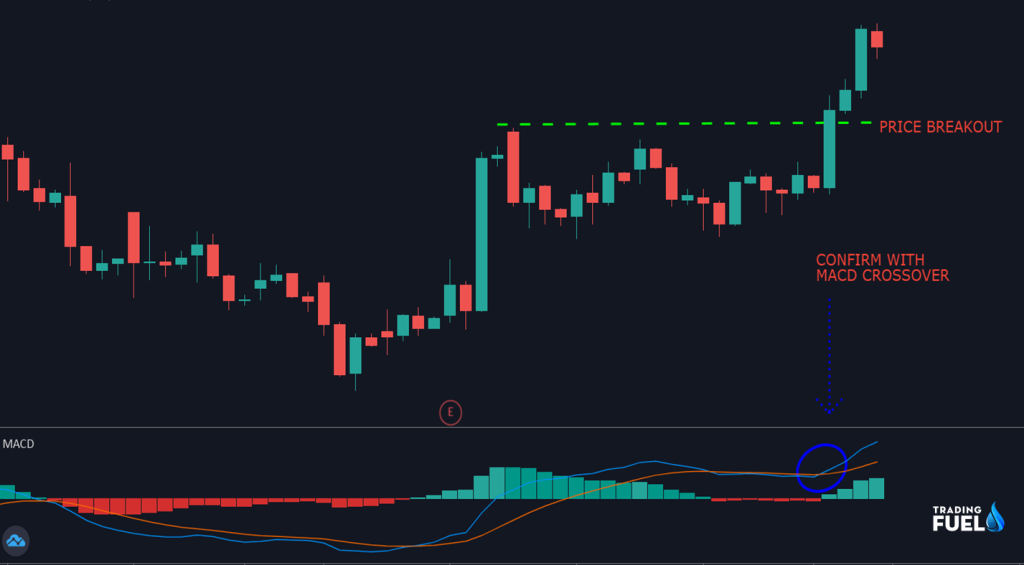
- Price action trading is a very popular technique, but some traders also use technical indicators along with the price action trading.
- As there are numerous technical indicators available, the most popular technical indicator used with price action is the moving average.
- A technical indicator can be used as a confirmation signal or it could be used to spot the false trade setup.
- A technical indicator is used to spot over brought or oversold level, to identify volatility, to find a trend, to look at the strength of the movement, etc.
Know More About: Top 5 Indicator for Trading
Conclusion:
In this article we have seen various aspect of price action trading, unlikely a technical indicator learning price action usually take time, it just not give straight buy or sell entry you have to analyze the share in such a way that you could understand how the market is behaving in different time frame and place trade accordingly. A technical indicator can be used as a confirmation tool so in case, we have interpreted price action wrongly we could save ourselves from a false trade.
Contain & Image ©️ Copyright By, Trading Fuel Research Lab