The Stochastic Oscillator is a momentum indicator that measures the relationship between the closing price and the range of an asset (usually a stock) over a set number of periods.
A stochastic indicator is a statistical measure used in finance and technical analysis to determine if an asset is overbought or oversold.
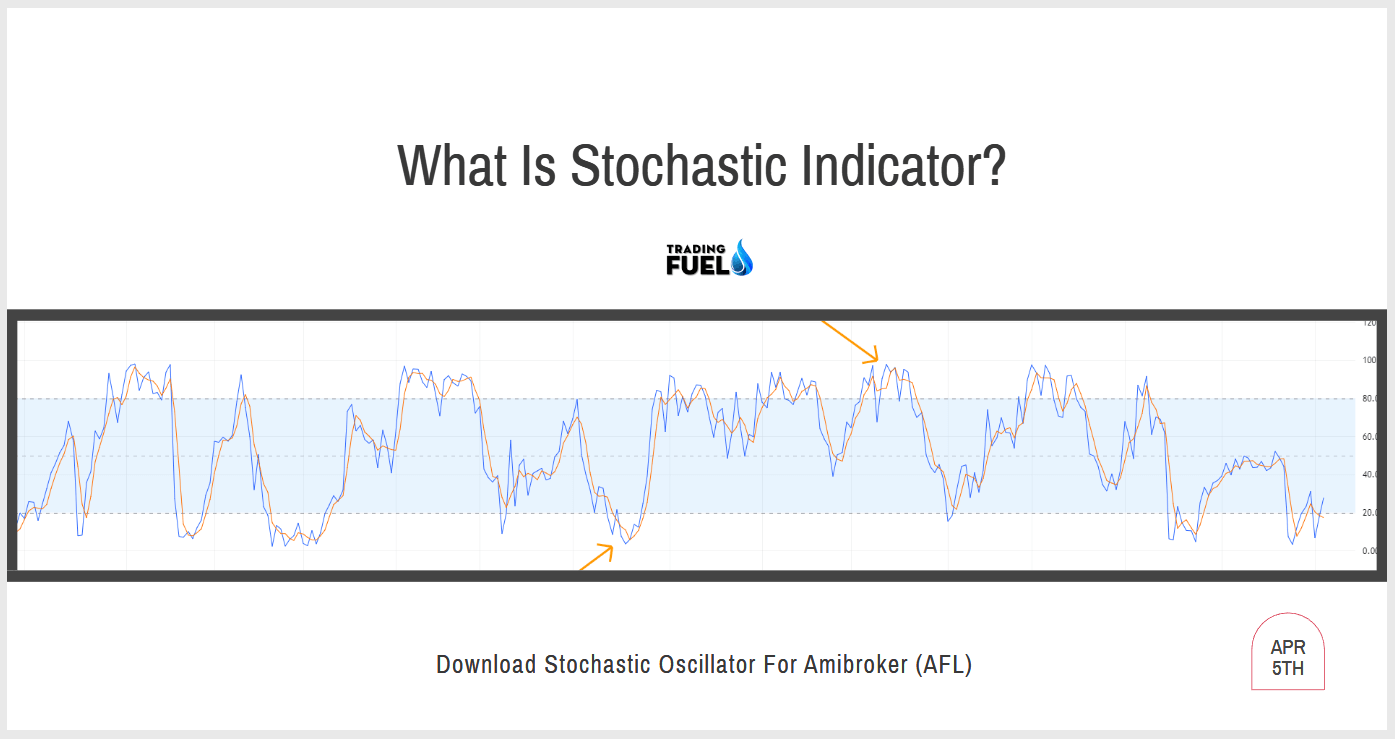
It oscillates between 0 and 100/ It compares an asset’s closing price to its price range over a set period of time, typically 14 periods.
A reading above 80 is considered overbought and a reading below 20 is considered oversold, indicating potential trend reversal points.

It is used to generate potential buy and sell signals and to indicate trend changes in the market. The indicator is based on the assumption that prices close near the high in an uptrend and close near the low in a downtrend.
How it works and calculated?
The stochastic indicator works by comparing the current closing price of an asset to its price range over a set number of periods.
It calculates the current closing price as a percentage of the difference between the highest high and the lowest low for a given number of periods.
The formula for calculating the stochastic indicator is as follows:
%K = (Current Close – Lowest Low) / (Highest High – Lowest Low) * 100
The resulting value is then smoothed using a simple moving average to create the %D line.
The %K line is plotted on a scale of 0 to 100, with readings above 80 considered overbought and readings below 20 considered oversold.
The idea behind the stochastic indicator is that prices tend to close near the high during an uptrend and near the low during a downtrend.
By comparing the closing price to the price range, the stochastic indicator provides insight into an asset’s price momentum and helps traders make investment decisions.
The Stochastic Oscillator is commonly used in the following ways:
1. Overbought/Oversold levels:
If the Stochastic Oscillator is above 80, it is considered overbought and signals a potential sell opportunity. Conversely, if the Stochastic Oscillator is below 20, it is considered oversold and signals a potential buy opportunity.
2. Divergences:
A bullish divergence occurs when the stock makes a lower low while the Stochastic Oscillator makes a higher low, signalling that the downward momentum in the stock may be losing steam and a potential upward reversal may occur. A bearish divergence occurs when the stock makes a higher high while the Stochastic Oscillator makes a lower high, signalling that the upward momentum in the stock may be losing steam and a potential downward reversal may occur.
3. Crossovers:
A buy signal is generated when the %K line crosses above the %D line, while a sell signal is generated when the %K line crosses below the %D line.
You also like: Volume Profile Indicator
Download Stochastic Oscillator For Amibroker (AFL)
// Downloaded From https://www.TradingFuel.com
_SECTION_BEGIN( "Stoch KD Cloud" );

/*
Stochastic is an oscillator that measures the position of a stock OR security compared with its recent trading range indicating overbought OR oversold conditions.
It displays current Day price at a percentage relative to the security’s trading range (High/Low) over the specified period of time.
In a Slow Stochastic, the highs AND lows are averaged over a slowing period. The default is usually 3 for slow AND 1 (no slowing) for fast.
The line can then be smoothed using an exponential moving average, Weighted, OR simple moving average %D.
Confirming Buy/Sell signals can be read at intersections of the %D with the %K as well.

The Stochastic Oscillator always ranges between 0% AND 100%.
A reading of 0% shows that the security’s Close was the Lowest price that the security has traded during the preceding x-time periods.
A reading of 100% shows that the security’s Close was the Highest price that the security has traded during the preceding x-time periods.
When the closing price is near the top of the recent trading range (above 80%), the security is in an overbought condition AND may Signal for a possible correction.
Oversold condition exists at a point below %20. Prices Close near the top of the range during uptrends AND near the bottom of the range during downtrends.

Source: Amibroker 5.20 Help Menu

BUY = When the Stochastic is below the 20 oversold line AND the %K line crosses over the %D line.
SELL = When the Stochastic is above the 80 overbought line AND the %K line crosses below the %D line.

*/

periods = Param( "Periods", 15, 1, 200, 1 );
Ksmooth = Param( "%K Avg", 3, 1, 200, 1 );
a = StochK( periods , Ksmooth);
Plot( a, _DEFAULT_NAME(), ParamColor( "Color", colorBrightGreen ), ParamStyle("Style") );
Dsmooth = Param( "%D Avg", 3, 1, 200, 1 );
b = StochD( periods , Ksmooth, DSmooth );
Plot( b, _DEFAULT_NAME(), ParamColor( "Color", colorRed ), ParamStyle("Style") );

PlotOHLC( a,a,b,a,"", IIf(a>b, colorBrightGreen, colorRed), styleCloud);

Overbought= 80; Oversold= 20;
Plot(Overbought,"OB",colorRed);
Plot(Oversold,"OS",colorGreen);

Buy = Cross( a, b );
Sell = Cross( b, a );
PlotShapes( shapeSmallUpTriangle * Buy + shapeSmallDownTriangle * Sell, IIf( Buy, colorWhite, colorWhite ) );

_SECTION_END();

_SECTION_BEGIN("Animated_BackGround_");
// http://amibrokertraders.blogspot.com //
//====================

for( i = 1; i < BarCount; i++ )
z = (GetPerformanceCounter()/100)%256;
anim=ColorHSB( ( i + z ) % 256, 255, 100 );
SetChartBkColor(anim);
RequestTimedRefresh(1);

//====================
_SECTION_END();
In conclusion,
the Stochastic Oscillator is a popular technical indicator used by traders to analyse momentum and potential trend changes in the market. It works by comparing the closing price of a stock to the range of its prices over a set number of periods and provides signals based on its readings. The Stochastic Oscillator can be used to generate buy and sell signals, identify overbought and oversold levels, and detect divergences.
However, like any other technical indicator, it has its limitations and should not be used in isolation. It is a lagging indicator that can generate false signals, and it does not take into account other factors that may affect the stock price. Additionally, past performance is not a guarantee of future results.
Contain & Image ©️ Copyright By, Trading Fuel || Research Lab